|
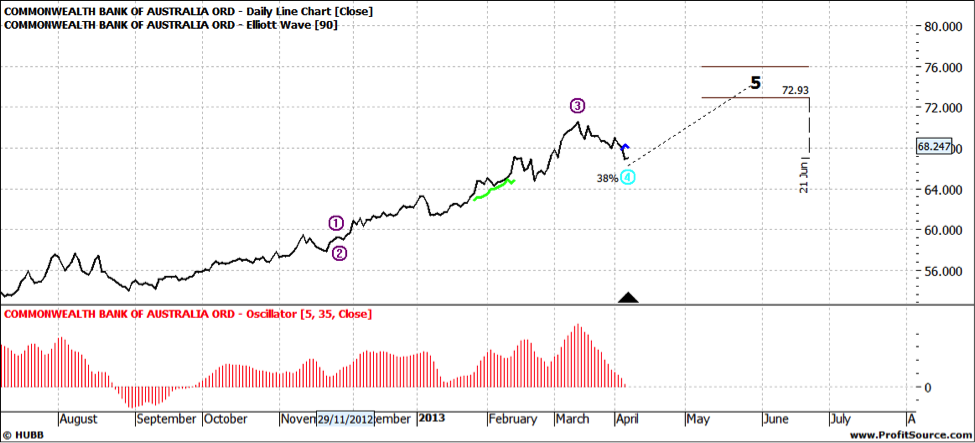
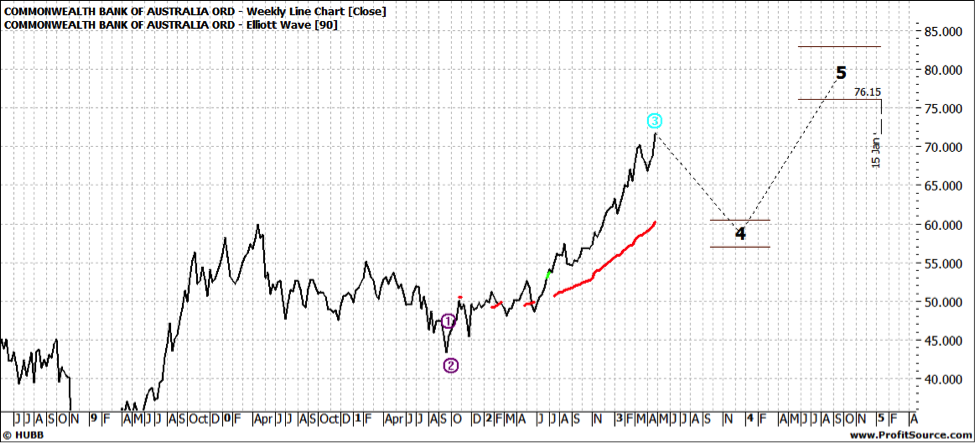
A few weeks ago we looked at CBA which was setting up a classic text book wave four ready to move to wave five. The stock moved as per text book style and now the question is whether one should cash in ones chips.
Well it always depends on when you bought in, what your time horizon is and your risk profile.
Let’s look at the chart from my last article:
Click to enlarge
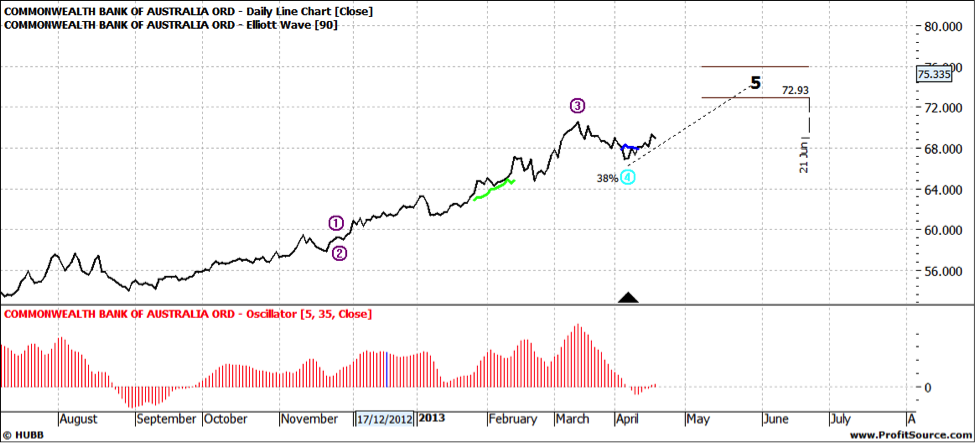
And then a few days after:
Click to enlarge
So in the first chart we see an enticing set up and checking a few days later we can see that the oscillator has held up well – no more than 10% below zero. So if you bought in at this time you will have made about 5% – not bad on such a trade with relatively low risk.
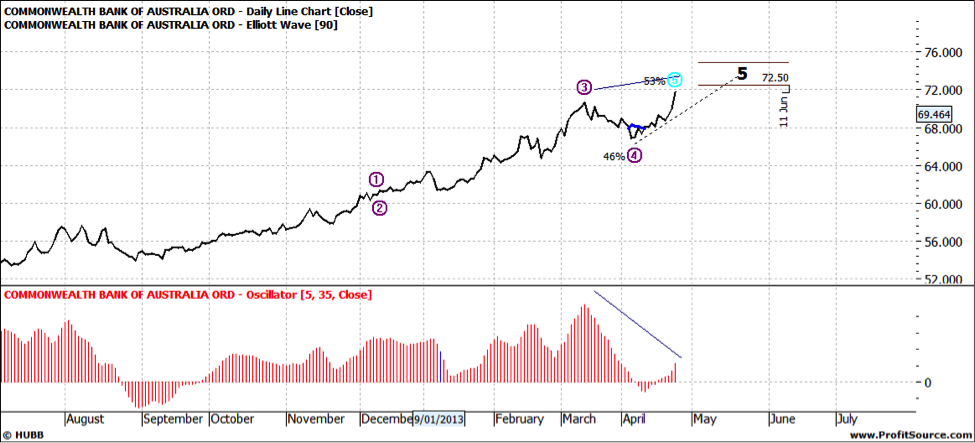
Let’s look at the chart now – as at Wednesday May 1:
Click to enlarge
You can see the first wave five is not far away. You will also note that the oscillator is quite weak – it has not risen to the same extent that the stock has risen – a negative diversion. This suggests to me that there will be some wobbles as the stock heads higher – and I do expect it will head higher. But the easy money has been made.
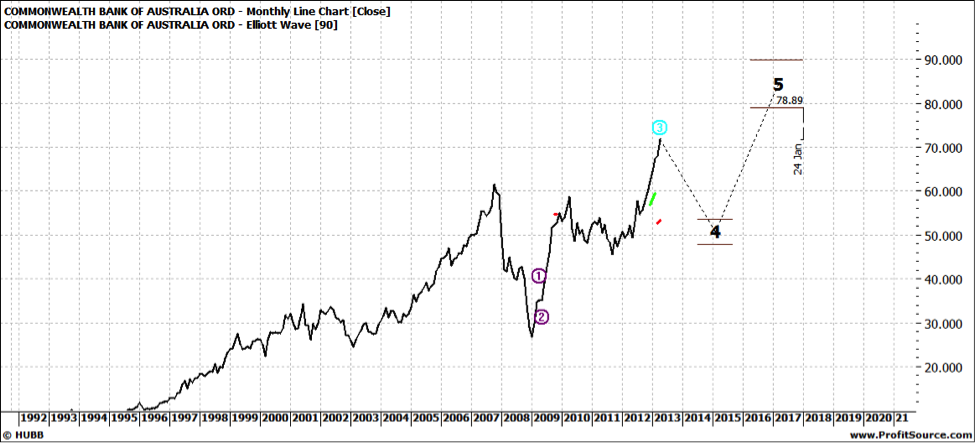
Let’s look at the weekly and monthly:
Click to enlarge
Click to enlarge
In both charts we see a pullback looming – on the monthly a very sharp fall – but it could be a couple of years away and the stock could head to $70 odd before heading south. The weekly chart is more conservative – not quite so deep pullback and nearer term.
I am aware some readers are waiting for this pullback – but you may just have to be patient.
If you are a long term player such a pullback may not be a concern in any way. It is part of the ride – the ups and downs!
If you are a short term player – you may need to start thinking “exit” – we never know what’s ahead. Greed rarely pays!
Enjoy the ride
Tom Scollon |