|
Mining stocks have risen over the last few days and so we ask, does this herald the beginning of a new dawn?
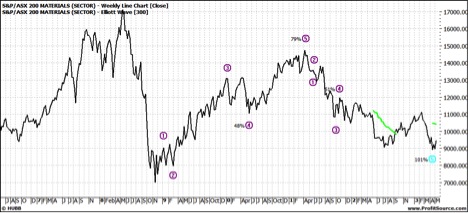
Let’s start with a chart of XMJ:
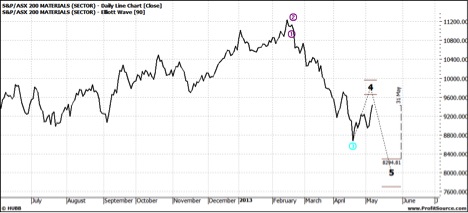
This suggests this buying is only a ‘dead cat bounce’ – that is it is an upward jump but maybe another leg down is not far away – like in the coming weeks. One of the reasons why the index may be sent lower is that those who hold mining stocks and doubt the mining medium to long term prospects are likely to sell. Selling will gather momentum and eventually this will sink the index and its leaders such as BHP and RIO.
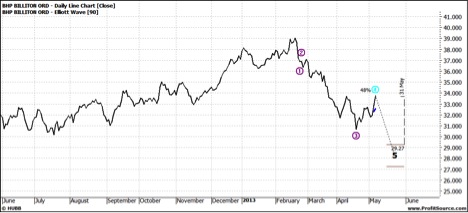
Let’s look at each:
In fact the above chart predicts a low by May 31.
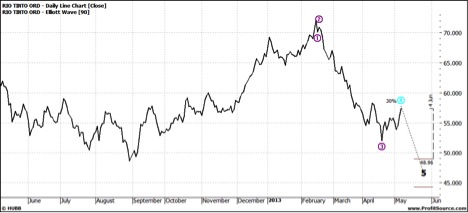
RIO’s low is a little further out – mid June:
My next routine is to look at a weekly chart and this time I am going to use a 300 week to look just that bit further out:
BHP:
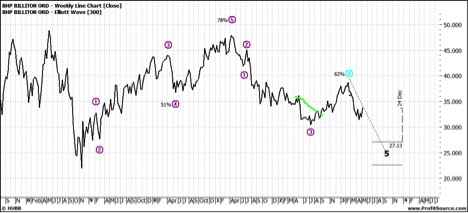
This chart suggests a low for BHP of around $25 by year’s end – unthinkable several months ago.
XMJ:
RIO:
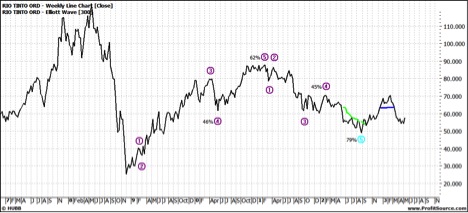
Both the XMJ and RIO weekly charts suggests the wave five low is not far away – but offers not even a glimmer of whether there could be a rally once the low is reached. So we will have to wait another few months before we can really say much about this but it does appear we could see a period of consolidation before the next move.
Enjoy the ride
Tom Scollon |