|
Trading is all about probabilities, and because it is about probabilities, we as traders must of necessity be concerned with the management of risk. Therefore our job has to be to find high probability set-ups. Our great advantage is that we can pick and choose our trades. Many fund managers are compelled to be in the market all the time, but there are many times when it is better to be out.
If you have been trading for any length of time, go and collect all your successful trades together and make a study of them. You will probably find that your best trades follow fairly simple set ups and have quite a number of ducks lined up in a row. Then compare your unsuccessful trades. These will often be the ones where you tried to force the market to do what you wanted, or you entered without a clear signal.
So as this year of opportunity in 2013 unfolds, what about specialising in high probability trade set-ups? If you could just keep your best trades and eliminate 75% of your mistakes, how much better would your account balance look? You will never eliminate all unsuccessful trades, because you are only dealing with probabilities, and many things limit your information, including your own beliefs about the market.
In this article we will look at the first higher bottom trade. This is definitely a high probability set up, particularly when you start to understand some of the finer points. In this context, the first higher bottom set up is distinguished from a double or triple bottom, which we could discuss at great length also. When you have a double or triple bottom, especially if there is time harmony and resistance levels involved, you have an immediate signal to go long.
But when you have a single bottom only, you will want to wait for the first higher bottom. This may be a first higher bottom on a 1-day swing chart, which is a specific trading strategy in the Number One Trading Plan, but it might not too.
The first item you will want to see will be time and price harmony at the low, which will be our Point A. Consider the current position of Apple (AAPL).
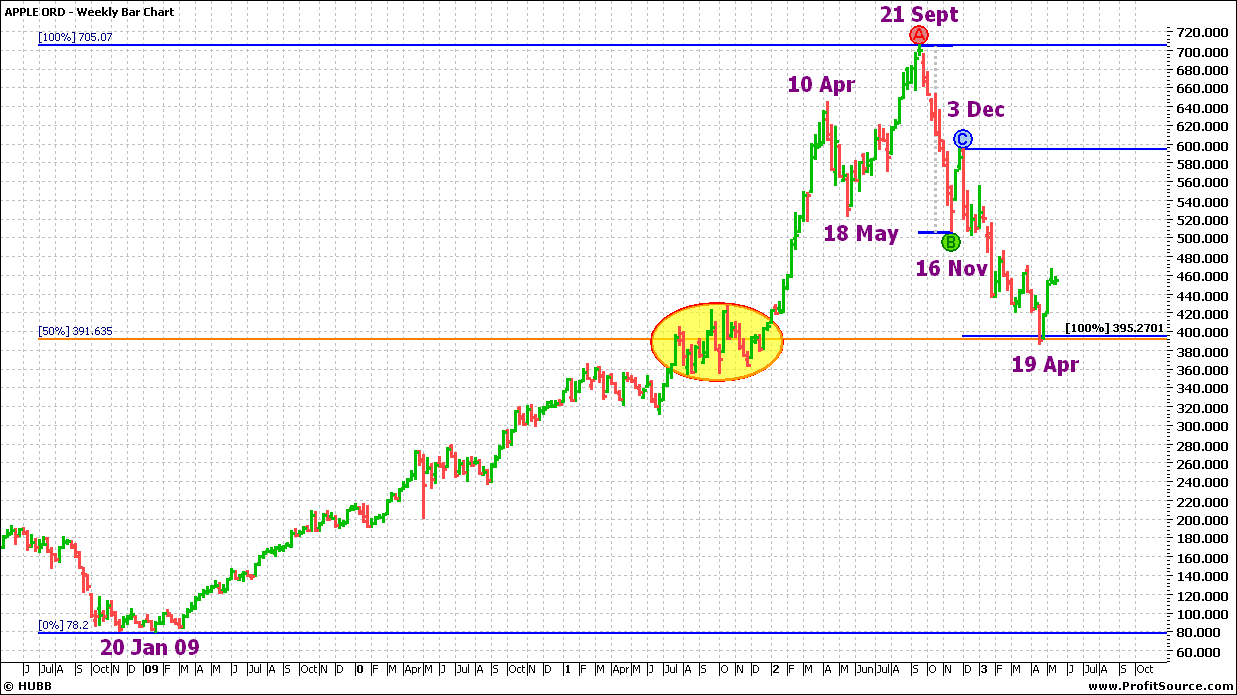
Chart 1 – AAPL Weekly
Click to enlarge
The big bull market in AAPL started in early 2009 from a triple bottom. In 3½ years the price rose from 78.20 to 705.07. Then, in the 7 months from September 2012 to April this year, it gave back half of these gains, and has currently found support at this 50% level. As you can see from Chart 1, the fall subdivided into 2 sections, which were almost exactly equal in length. This recent low on 19 April was very close to the anniversary of the 10 April 2012 top. Also on the chart you can see an area of price congestion (circled). These are good areas to find support.
Therefore we can happily call the 19 April low a potential Point A. It has time and price harmony. Could you have gone long from this point? To answer this we need to look at the daily chart.
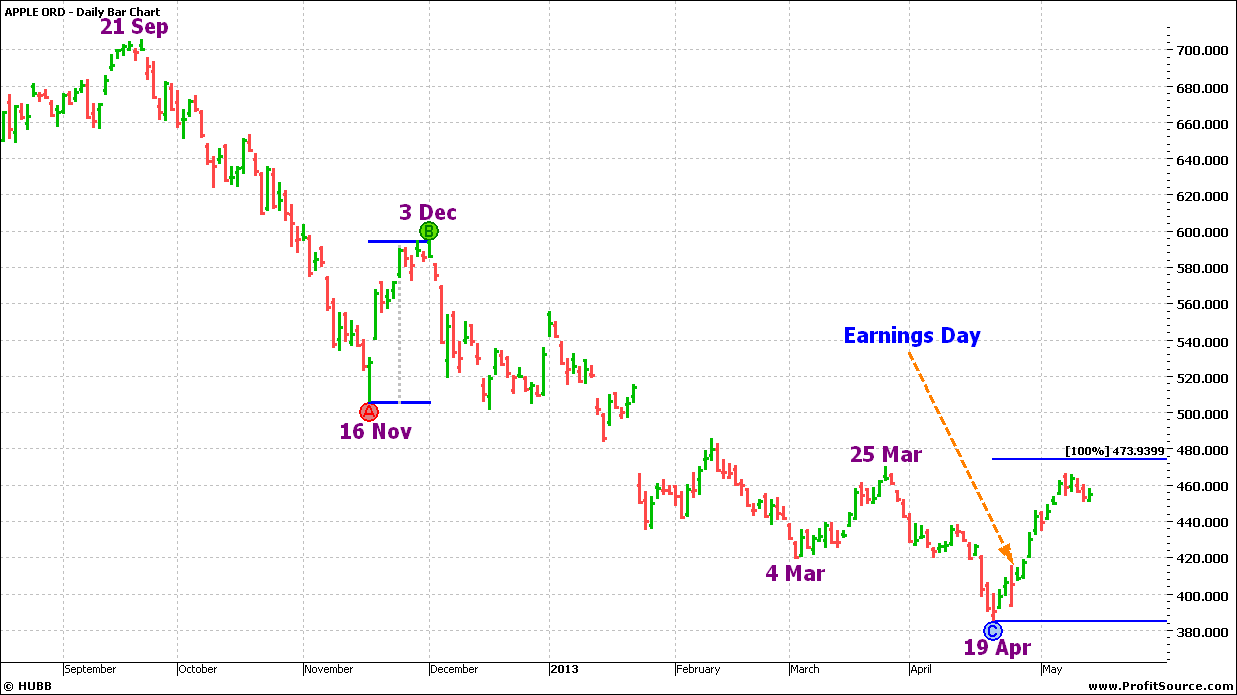
Chart 2 – AAPL Daily
Click to enlarge
The first higher 1-day swing bottom occurred 3 days after the 19 April low. However, this was an Earnings day for AAPL. These days are notoriously volatile. You can see a large gap in the middle of the chart, caused by the pervious Earnings day. It is much safer to stand aside on these days, as discretion is often the better part of valour in the markets.
If you place your ABC long hi-lites on this chart you will see an ABC long trade signalled today (14 May) with a 21% retracement from B to C. These are very low probability trades. The AB range is too large and the BC range is too short. The market is not balanced. Furthermore, the current rally is close to a 100% repeat of the largest rally since the 21 September top, which occurred from 16 November to 3 December. It is also close to a double top with the last high on 25 March. As it hasn’t broken that high yet, the market is still making lower tops. It would not be at all surprising to see this ABC trade filled and then for the market to hit that 100% milestone, make a double top, and then reverse.
Chart 1 also shows that there was a significant turn on 18 May 2012. Mid-May is always an important time to watch for market turns. One reason for this is that the New York Stock Exchange opened for the first time on 17 May 1792. Just as the birth date of a stock or commodity is a time to watch, so is the birth date of an exchange. Look up this date in previous years and see for yourself how important it is.
So, in its current position, AAPL would give a very low probability long trade, and might even be considered for a short trade. But remember the support at Point A shown in Chart 1. If you were to take a short trade, which after all would be with the trend, you would have to watch this low.
A first higher bottom should form on a retracement of 50%, 62.5%, 66.6% or 75% of the first range up from the low. If it retraces further than 75% there is a good chance that the low will be broken (or a double bottom formed). If the retracement is less than 50% it may be a strong market, but there is also a good chance that the pull-back is not yet complete, and if you get in early you can be stopped out quickly.
You would also look for harmony in the time moves. The number of days from B to C should be proportional (that is, 50% or 100%) of the time from A to B. Volume should also decrease on the pull-back. Large moves can only take place when big traders have had time to accumulate a position. You have to be patient and look for the signs when the accumulation is complete and the move is ready to begin.
But when you get these factors coming together – time and price harmony at Point A, and the right volume and pattern at Point C – you have a high probability set up for a trade that will go for a larger distance than the first range out. When they don’t, the market will tell you and give you other opportunities. You will make profits and avoid losses.
Knowledge is Power! Tim Walker |