| After my recent article Clusters not Clutter I was thrilled to receive some emails from students telling me they did their own analysis on ANZ and were able to profitably trade the ensuing fall in the market. In fact one student was able to increase his account size by about 80%! Congratulations. This has lead me to discuss possible ways of trading this move, as it required trading a change in trend, and whilst it sounds exciting, it is the with-the-trend trades that keep us in longer moves.
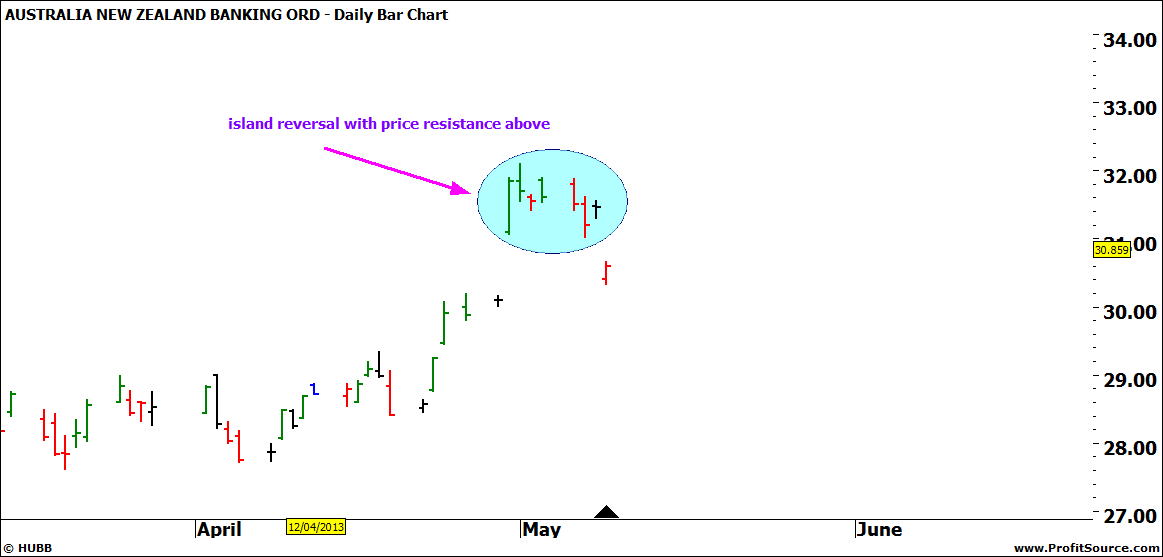
A quick review of the setup in terms of price tells us that we had a cluster of price resistance above the top in May formed by the lows resistance card, and old top, and ranges repeating into that top. The 1 May was also 360° from another pullback in the market and the payment of the dividend caused an island reversal pattern to form. Combined with such a price cluster the island reversal can be a powerful signal.
Chart 1: ANZ with Island Reversal Pattern
Click to Enlarge
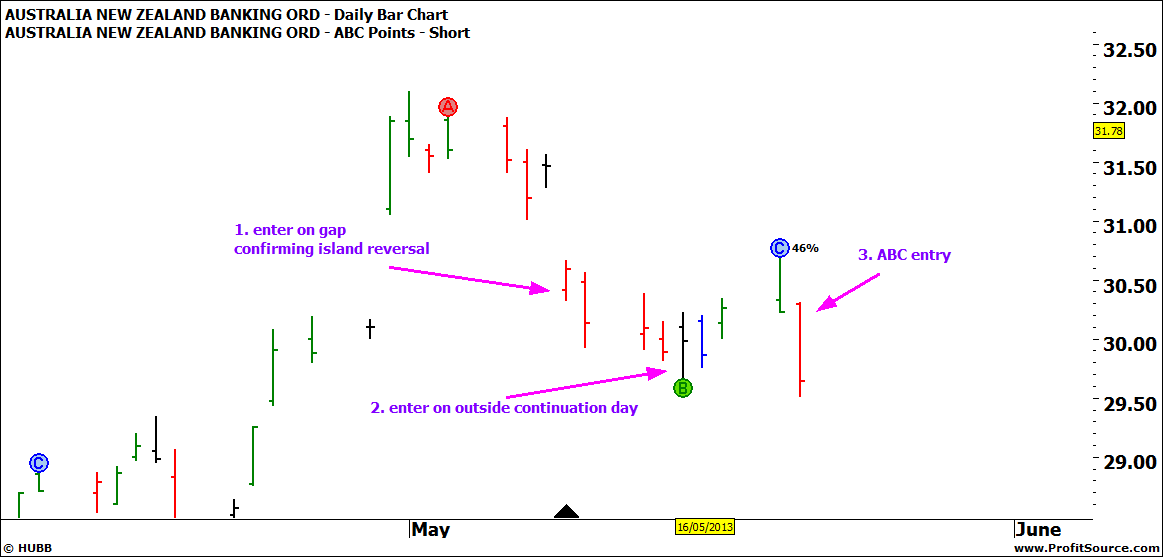
There were 3 possible initial entries you could have taken. The first was on confirmation of the gap on 9th May. This was the ex-dividend day and entering on this day you would have avoided having to pay any dividend out of your profits. Stops could have been placed 1/3 average range behind the gap, which was just above the low of the inside day. This would mean a risk of about $1.00 so your position size would be calculated accordingly.
The second possible entry could have been on the outside continuation day on 15th May, normally with stops behind the high. This would have seen you stopped out on 17th for a loss, and if you had added to your position at this point you would have moved your stops down for your initial position and been stopped out of the lot.
Here’s where some backtesting and experience come in. Having traded a similar scenario on CBA back in February 2011, I was expecting ANZ to come back to test the gap at some point, so I was prepared to take a smaller position at this point and keep my stops behind the gap for longer. Once the ABC trade came up on 20 May, then I was prepared to move all stops behind C and saw the trade as “really” underway.
Chart 2: ANZ Daily Bar Chart with Possible Entries
Click to Enlarge
If you put a swing overlay on the bar chart you will see that what I was in fact doing was waiting for a lower swing top to move my stops. And in hindsight we can see that the third entry was really all you needed. Yet again a basic ABC trade proves its worth!
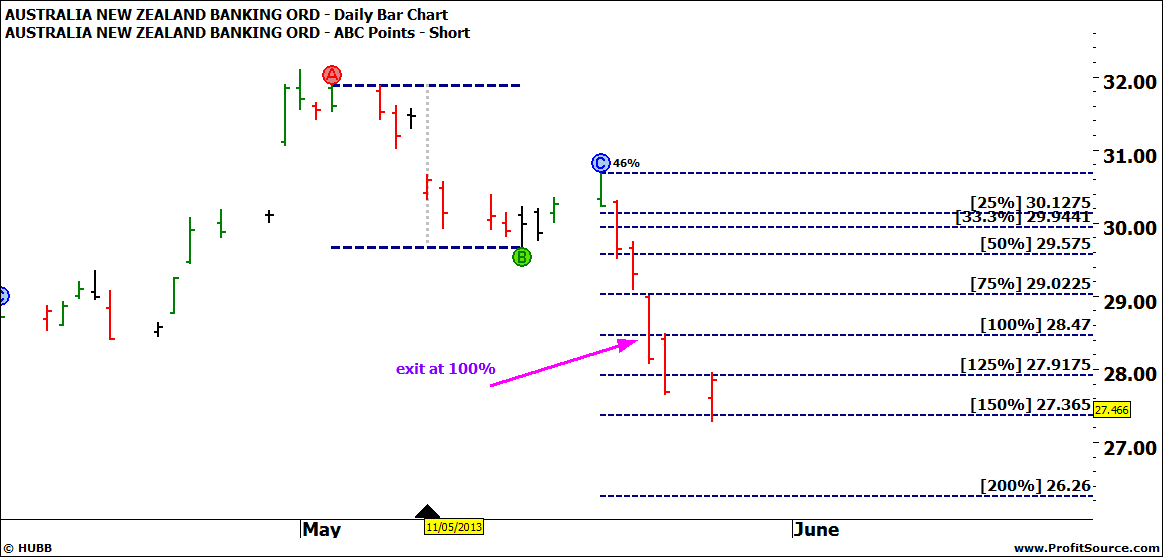
Now how to manage this trade: As we often joke, it is only after the trade has played out, with the benefit of hindsight that we can determine the ideal way to have managed a trade. You might like to test out the various results you would have attained using each of the methods from the Smarter Starter Pack and the No 1 Trading Plan. I am going to suggest that with the significant price cluster of resistance above the top that we were potentially looking for a pullback to match or exceed the previous three pullbacks. It is interesting to note at this point these pullbacks occurred in Oct-Nov 2011, May 2012, Oct-Nov 2012, and now we were looking at another in May 2013.
For illustration I am going to use a split position, with half managed using milestones and half trailing stops behind the 1 day swing chart. The only challenge I have with this is the position trailing behind swings is still in play, with as yet unrealised profits! Let’s say you entered the market on 21st May. You could have taken profits on half your position at 100% on 23rd May using the currency style of stop management.
Chart 3: ANZ with ABC Milestones
Click to Enlarge
If instead you were using the milestones from the previous pullback you would have taken profits on 24th May at 100% of that range, and a little better than 125% of the ABC.
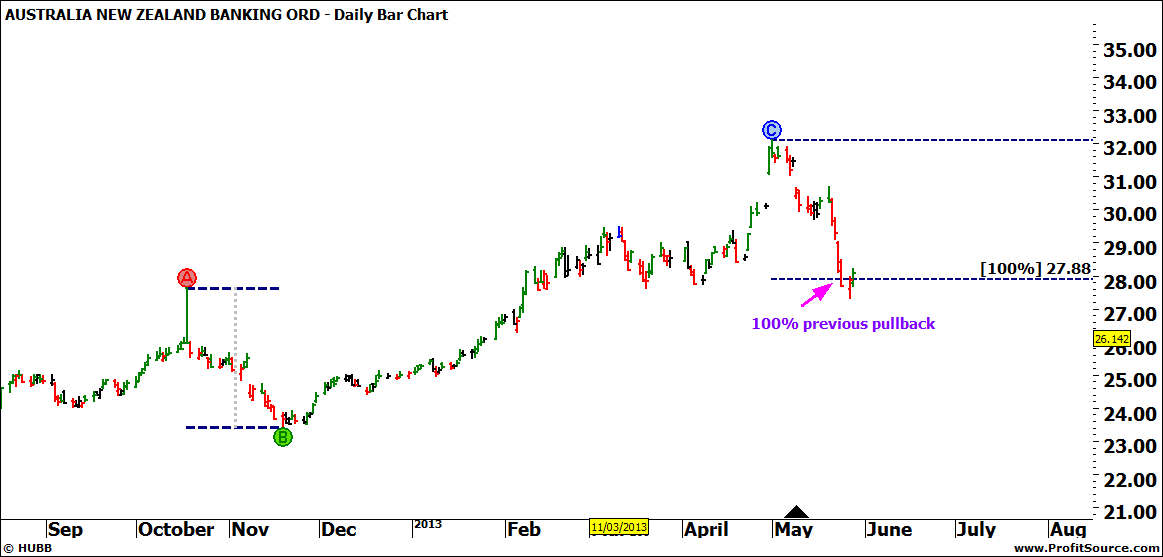
Chart 4: ANZ with Repeating Pullbacks
Click to Enlarge
You may have noticed that another ABC short formed after this and failed at 50%. Depending on your rules you may or may not have taken this trade. For example, as a single ABC it had an abnormally large range so that alone might keep you out. However, you might have a rule to take every with the trend entry signal once you are in profit on a move and that would then be valid.
Now half of the position is still in the trade and the stops are behind the last swing top. This means if the market moves up and takes out that stop it will be slightly less profitable than the 27.88 stop. Time will tell if another lower swing top forms.
Chart 5: ANZ with Trailing Swing Stops
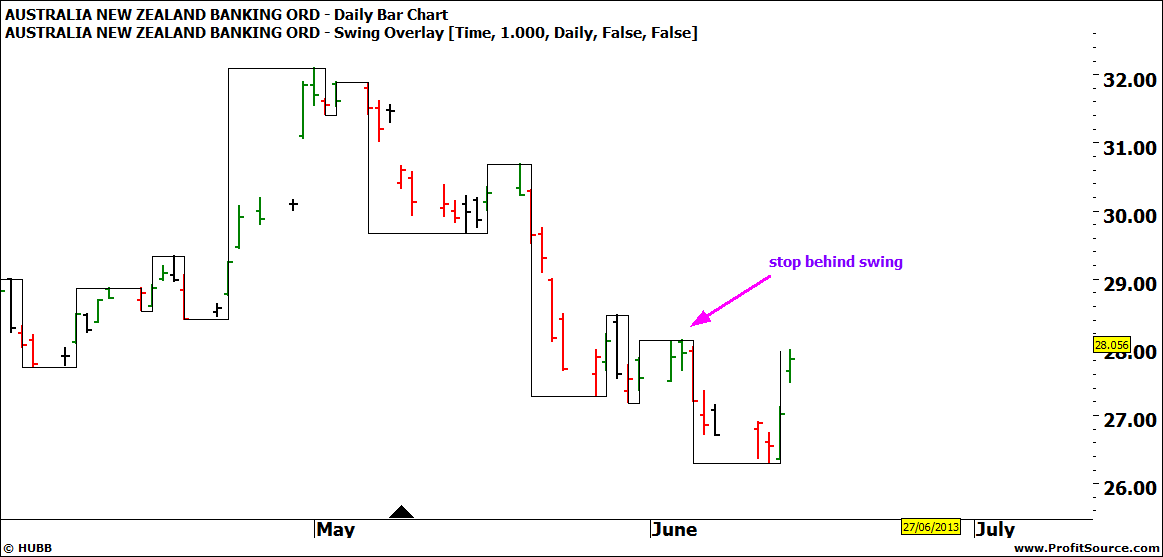
Click to Enlarge
By trading the ABC trade alone you could have achieved a reward to risk ratio of about 5:1. This means a 25% return on your account if you risked 5%. We don’t need such a fantastic setup for every ABC trade that comes along, but when we have a fantastic setup there is so often a simple way of trading it that can be very profitable. I would love to hear about some of your successes.
It’s the Journey
Lauren Jones |