|
Since my last article we have seen the Australian finance stocks rally from early June and the SPI rally from late June. Yet again, the banks have lead the SPI. We are at present seeing a slowdown across both the US and the Australian equities, and I for one am watching closely to see if they will continue higher or fall from these levels. If they do fall I can imagine some dramatic moves.
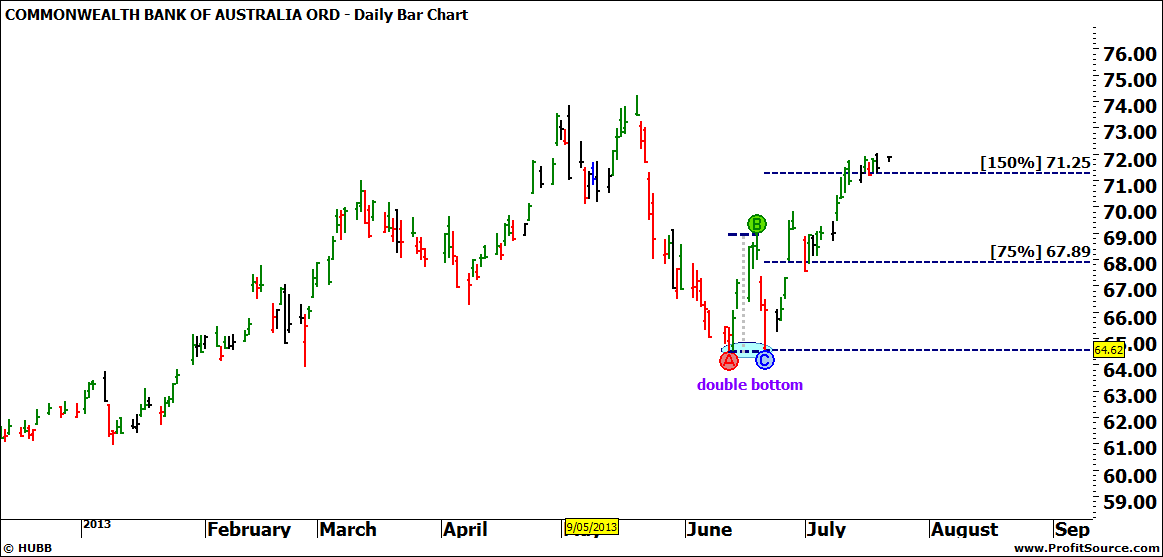
After trading ANZ in recent times, I fell back into the arms of my old love CBA for the rally off the double bottom on 21 June, and so far it has proved worthwhile, as you can see in Chart 1. By trailing swing bottoms you would still be in the trade as of market open on Monday 22nd July.
Chart 1: CBA with Double Bottom Trade
Click to Enlarge
Seeing the setup on CBA turned my attention to another old friend “the SPI”, or the Australian Share Price Index futures contract. This can also be traded by CFD with most brokers. There was so much price support that it was easy to trade the recent rally, and if you were able to couple this with second and third dimension analysis you would have been very confident to trade long here. The following 4 charts illustrate the price cluster which supported the recent rally on the SPI.
Chart 2: API-SpotV with ATL Resistance Card
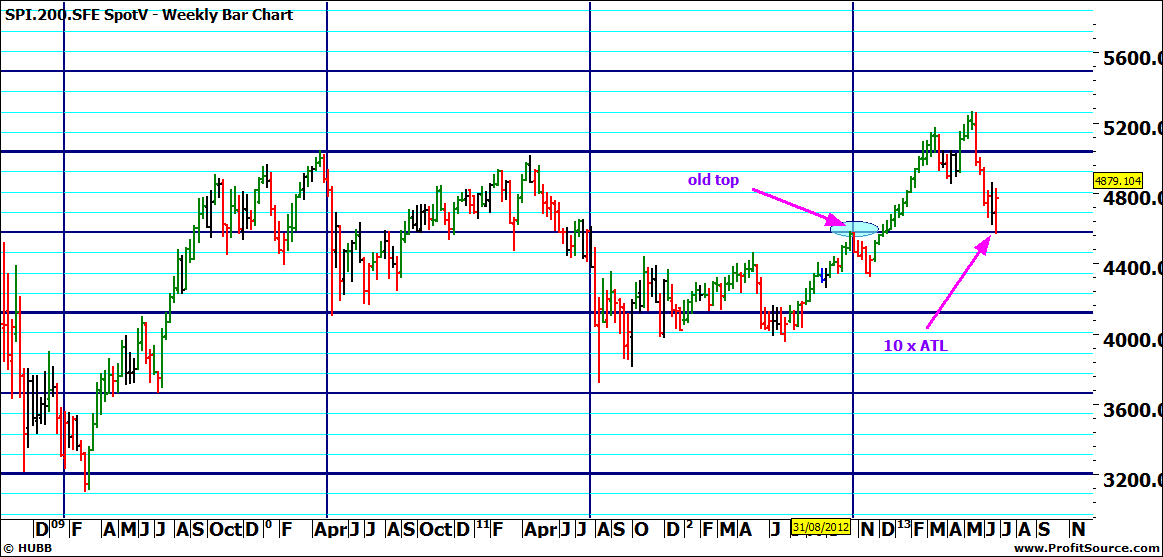
Click to Enlarge
Chart 3: API-SpotV with Ranges Resistance Card
Click to Enlarge
Chart 4: API-SpotV with Range Repeating
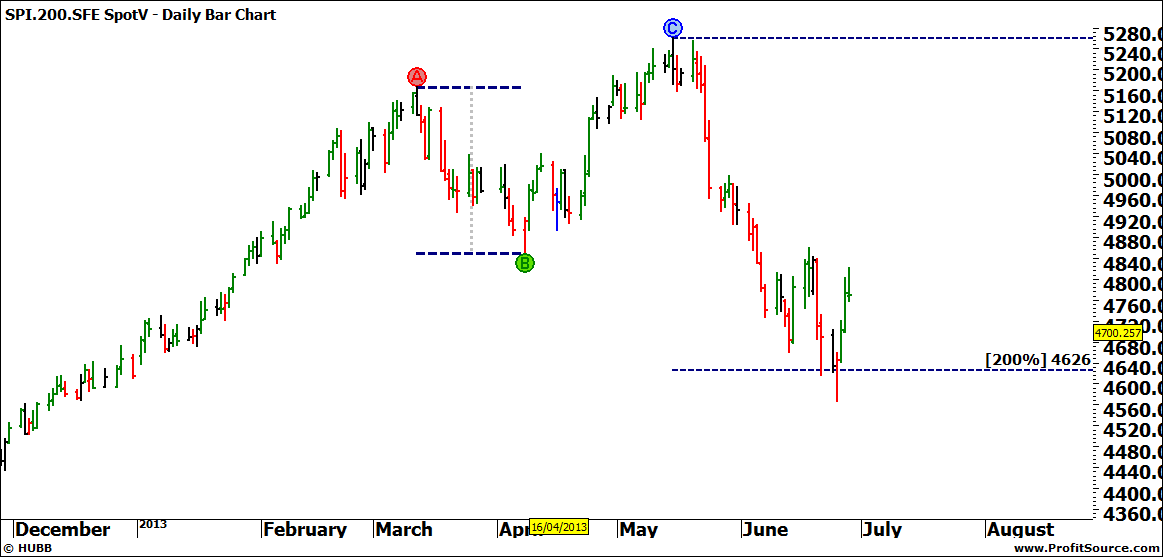
Click to Enlarge
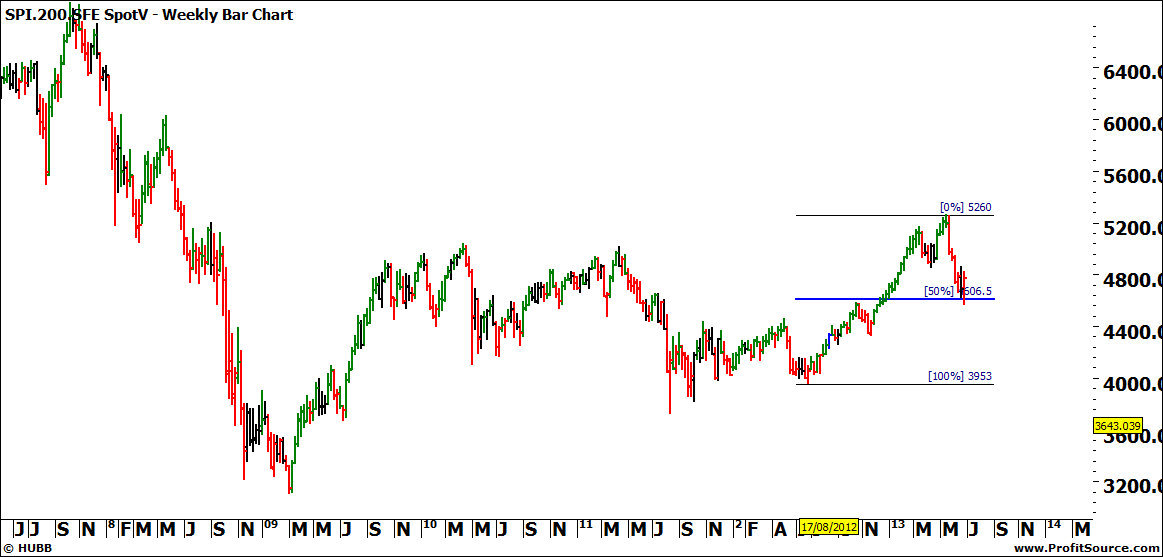
Chart 5: API-SpotV with Weekly Range Failing at 50%
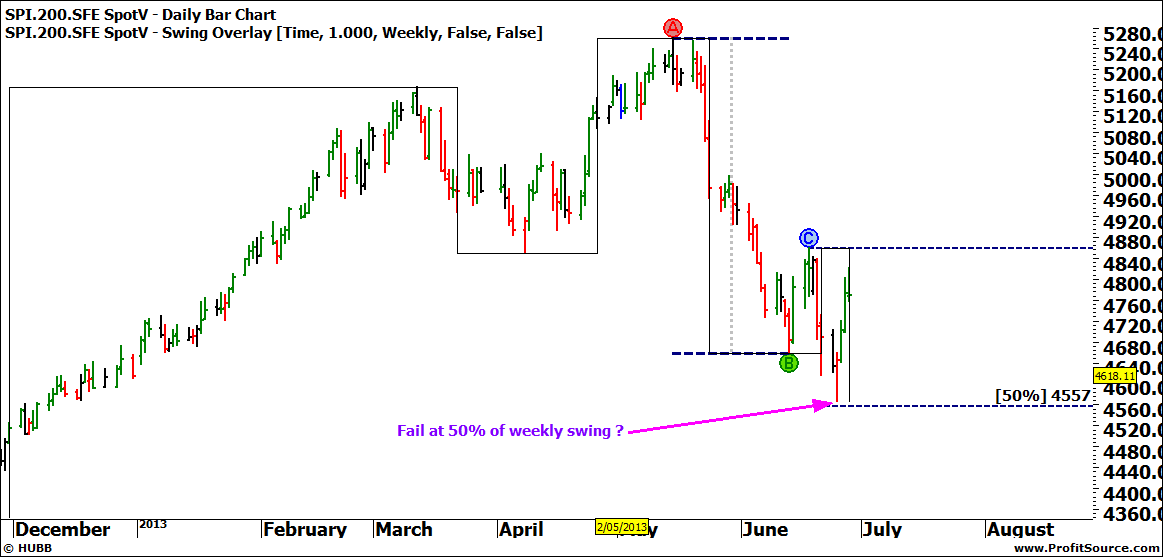
Click to Enlarge
Now the market has rallied from here and slowed down to a sideways wander over the past week. Could this be the end of the rally and the formation of a lower swing top on the monthly chart? By keeping stops behind one day swings any long trade on the SPI would have been closed on Friday 19th July with the outside bar.
Chart 6: Monthly Swing Chart on API-SpotV
Click to Enlarge
We are now facing resistance again. If the market breaks through here it is looking very strong and we can look for more opportunities to trade long with the trend. However, let’s take a look at the resistance and discuss how this compares with the support at the 4565 level. In Chart 7 I have shown the small picture range with a potential double top pattern. You might like to check out the Time by Degrees harmony here as well.
Chart 7: API-SpotV with Double Top Pattern
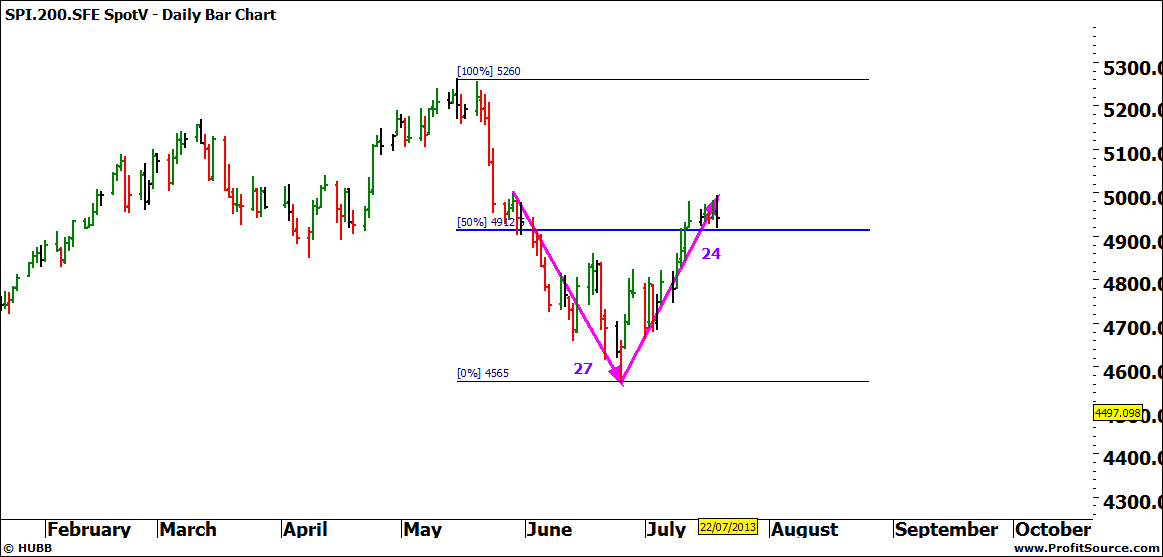
Click to Enlarge
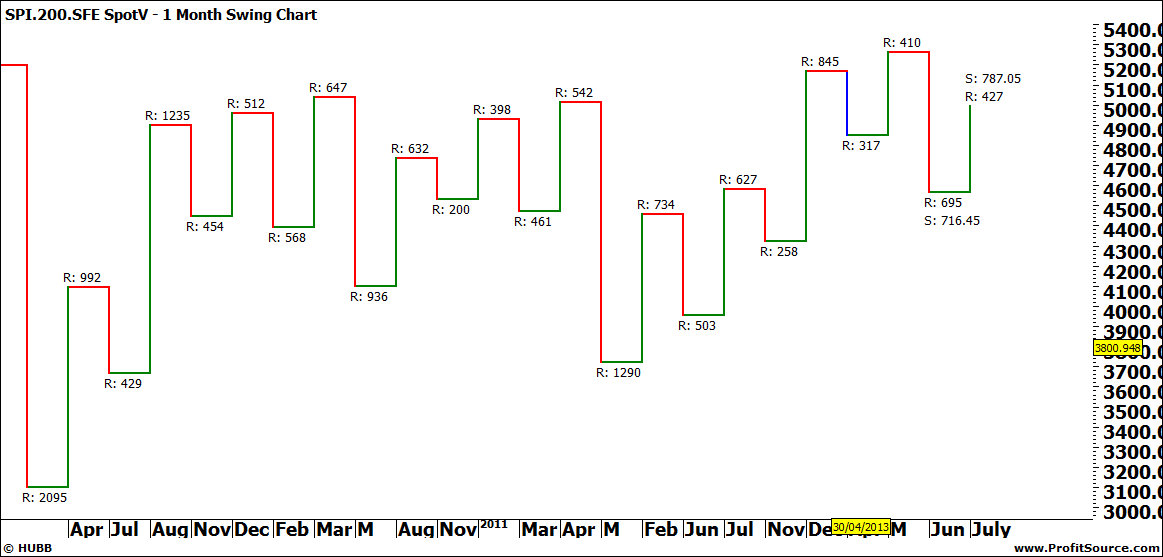
In Chart 8 I have shown a bigger picture range. This is what we call the GFC range, and the 50% level has proven before to be a strong area of resistance. Could a lower monthly swing top be forming under here?
Chart 8: API-SpotV with GFC Range Resistance Card
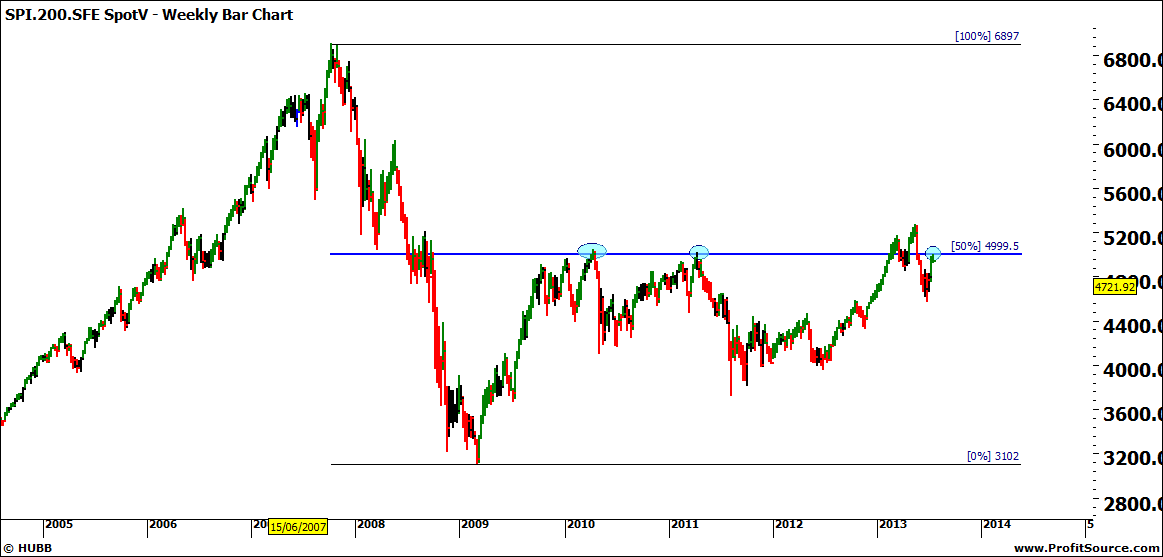
Click to Enlarge
Volume has so far been low and there has been no strong indication that it will move either way. If you are still in long trades then keeping your stops close will enable you to lock in profits if the market does fall from here. We are facing a simple price cluster with some Time by Degrees in the present resistance, whilst the support for the June low held multiple price and time reasons, as well as support from angles.
Whichever way the market moves, by stalking it closely, watching the swing charts and being ready to stop and reverse, you too could be on the next move when it takes off.
It’s the Journey
Lauren Jones |