|
Markets are now showing signs of weariness. As I write the DOW has had three consecutive down days. No big deal. It is not about to collapse tomorrow – I don’t think. But upward momentum has eased.
Three USA gurus were recently quoted as saying the market is reaching the top.
Warren Buffet was quoted as saying ‘We’re having a hard time finding things to buy’. Again no big deal and he certainly is not going to say markets are about to fall over as so will the value in all the buying he has done over the last five years collapse.
Carl Icahn was reported as saying “Right now, the market is giving you a false picture. ‘
Stanley Druckenmiller apparently said but if you tell me QE is going to be removed over nine or 12 months, that's a big deal because when it's my belief that QE has subsidized all asset prices. And you remove that subsidization, the market will go down.
(http://www.businessinsider.com/druckenmiller-icahn-and-buffett-on-the-stock-market-2013-9#ixzz2fwUiRxcq )
We should remember from previous market experience and history that markets go to extremes – at highs and lows. That is they over extend each way before a dramatic correction occurs. We are by no means at an extreme and there are no signs that markets will topple in the immediate term.
I also noted during the week how the RBA warned against a possible bubble in residential prices in Australian as a result of Superannuation monies from Self Managed Funds is supposedly fuelling prices in recent months. Again residential prices are not about to implode but we know that market buyers ignore warnings as they think that ‘I can have one last profitable bite of the cherry OR ‘prices may come back but they won’t collapse’ OR ‘we got to get in before we miss out – I don’t want to be left lonesome without a house in this market’
Let’s look at the charts and check are we seeing confirming signs – at least in equities.
The daily DOW:
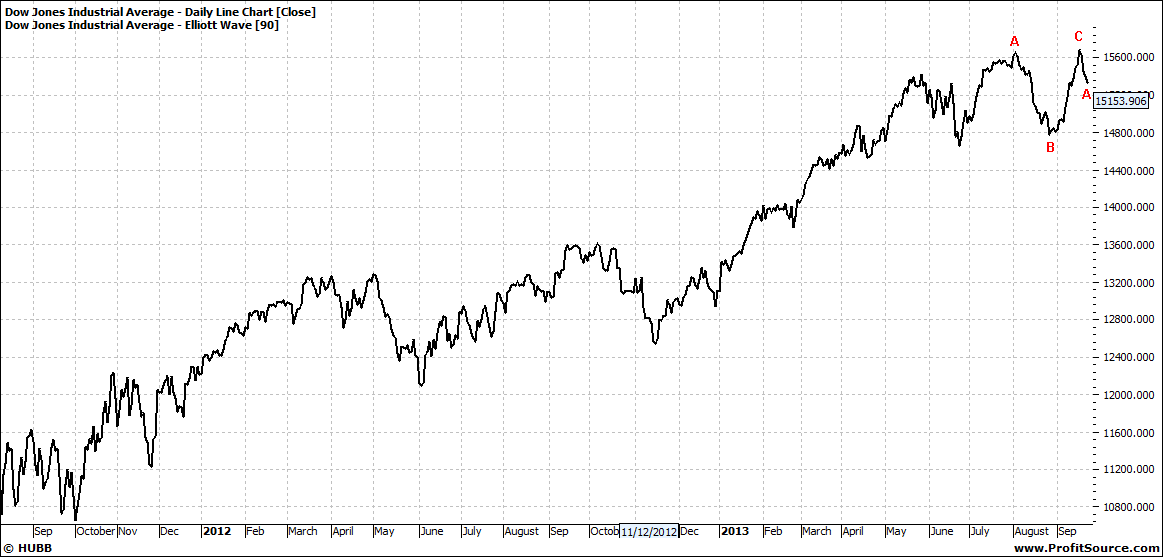
Click to Enlarge
This merely says that the trend has eased – slowed – maybe stopped.
The weekly:

Click to Enlarge
This says that the first wave five has been reached. This means that in normal circumstances the market could go higher – but if any really adverse news appeared on the scene then it won’t go much higher.
In this next weekly chart of the DOW we take particularly interest in the Bollinger Band – an indicator of over bought or sold markets.
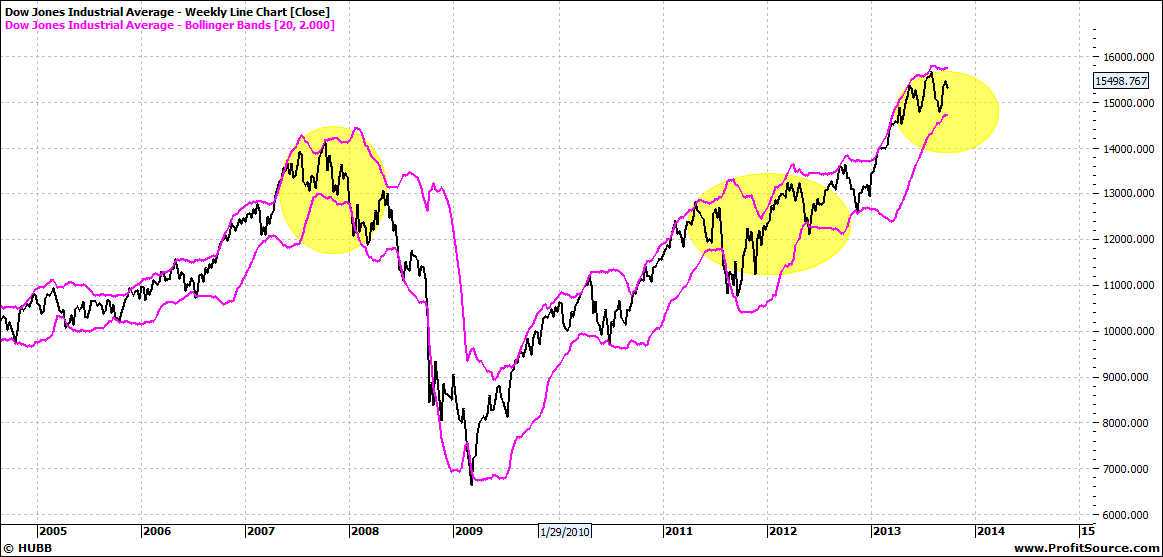
Click to Enlarge
There is nothing untoward but we do note that the bands are going to run sideways. I have highlighted two other periods where we saw this. In 2012 this was merely a base for the next move higher. But in 2007 it was just before the market collapsed.
Again I am not suggesting a market collapse. As markets need to ‘over cook’ first – and that is what causes markets to not just collapse, but to go over a precipice and fall to another extreme.
The nature of markets. I will watch with keen interest.
Enjoy the ride
Tom Scollon
|