Well I rarely make such a definitive statement but I am sure many of you have been wondering should you sell, take profit or top up. So it is worth a little look.
Let’s start with the sector index:

Click to Enlarge
Click to Enlarge
Click to Enlarge
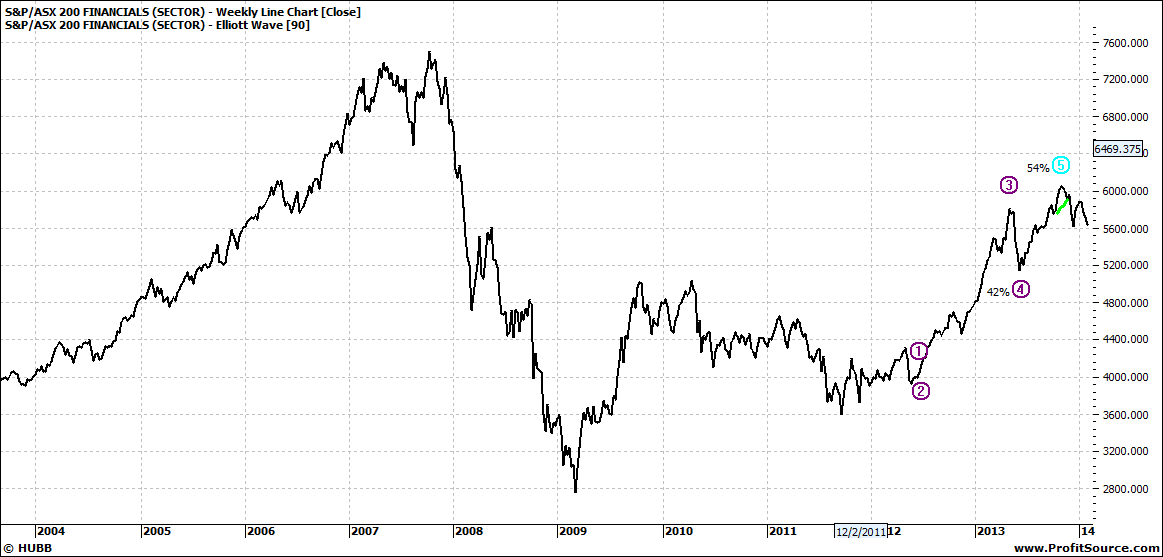
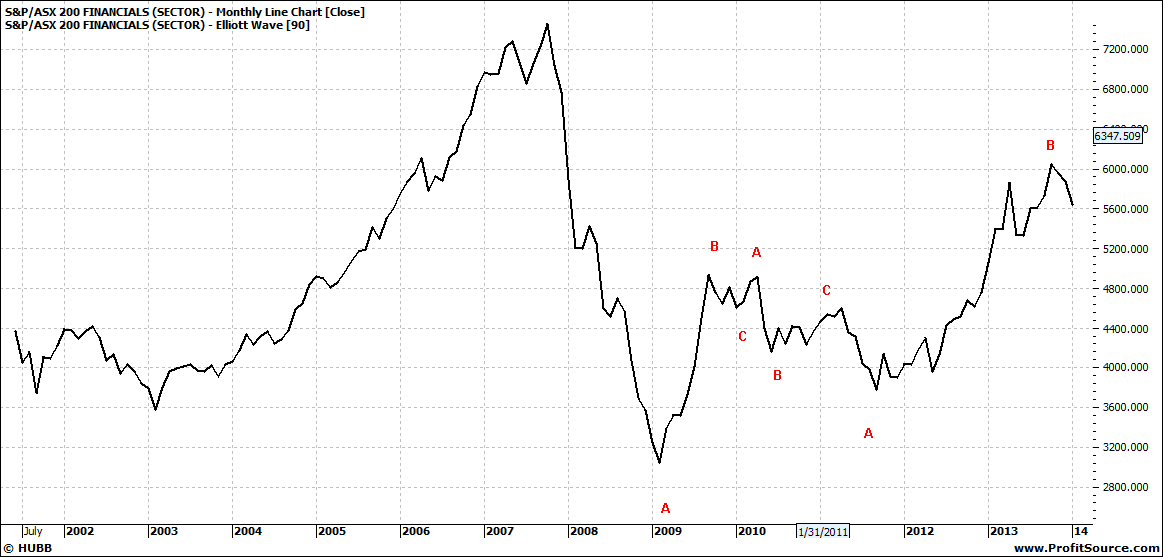
So we see above the daily, weekly and the monthly – in that order.
I look at the monthly as a matter of interest – it is not a tool for short term investing – it is not ‘the here and now’. But we can see the sector has been to heaven and back, and now lingering a little. There are no indications on this chart that it will attempt to scale the previous giddy heights. It will of course but no immediate signs.
The weekly is a similar picture but tells us a little more. That is, that the first wave five has not been quite met – but also we know that there are more than one wave fives. But we do also know that weekly patterns take forever to unfold. So we could be talking months before we see any clear pattern emerge.
So in the meantime we focus on the daily and that tells us the sector is currently going through some softness. And that it could go back to even two year lows. Could. That does not mean ‘will’. Of course this is question a critical issue for some buyers of the last two years. But there are many issues to consider which I have previously written about. Such as time frame, pain threshold etc.,
It will also depend on the banks you hold. For example CBA and NAB look reasonable steady:

Click to Enlarge

Click to Enlarge
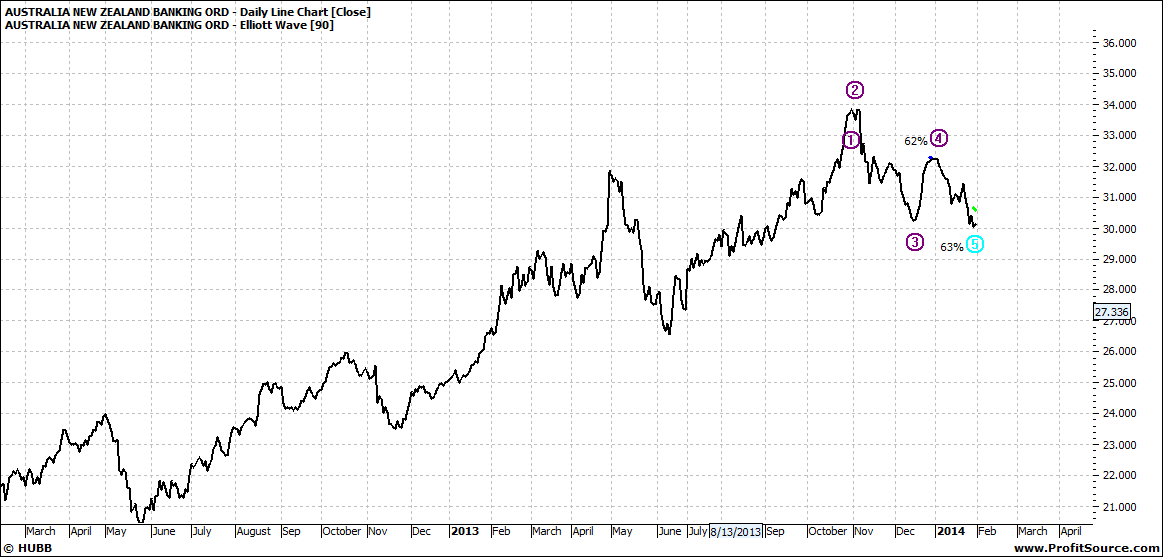
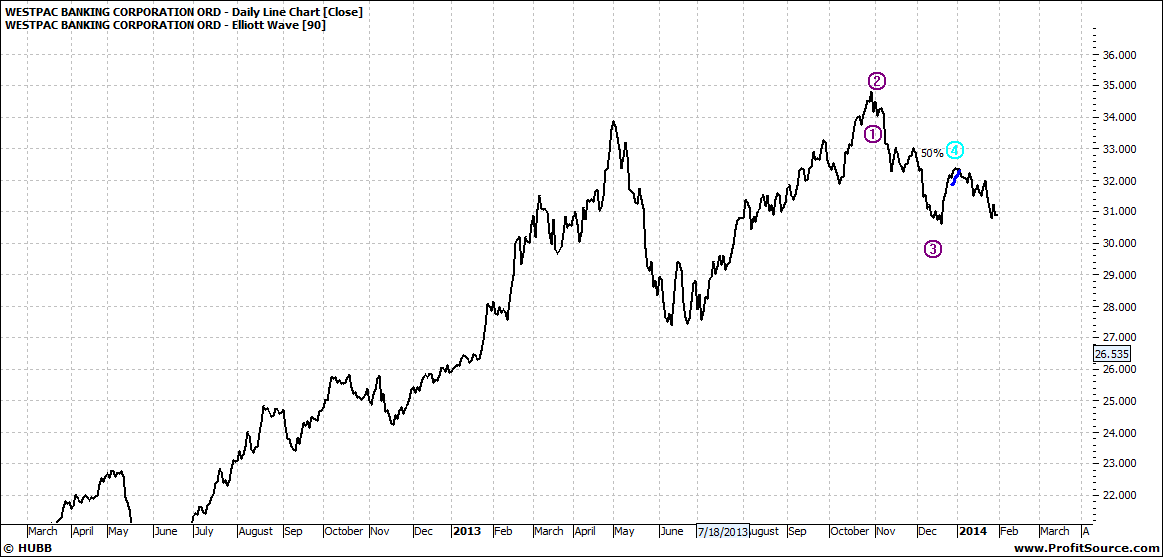
Whereas ANZ and WBC look soft:
Click to Enlarge
Click to Enlarge
Nothing to be overly worried about – but just good to keep a closer look and not be too cavalier!
Markets are generally look mildly soft – but at this point nothing too serious.
Enjoy the ride
Tom Scollon
|