|
Well not even the odd poor surprise economic data really unsettles the markets these days. Most news is mostly good news for the moment. We are however reaching a top. So let’s review the charts.
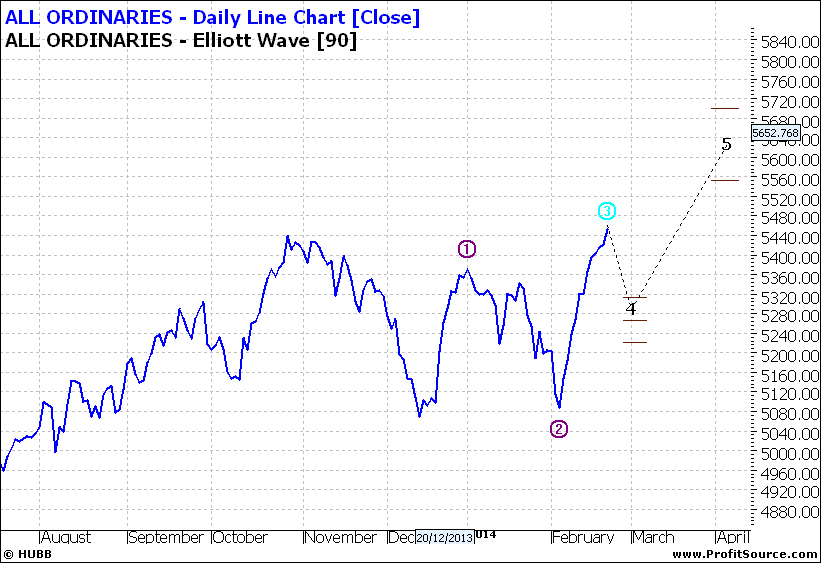
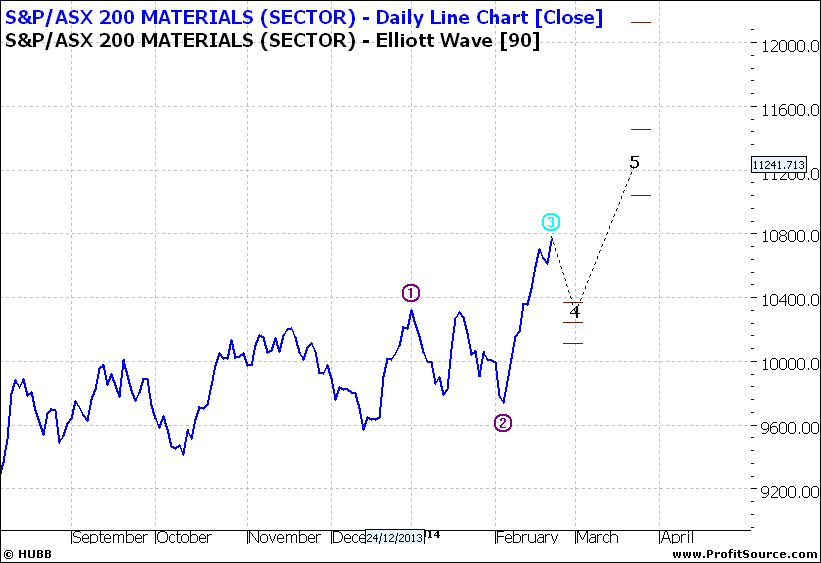
Firstly the XAO:
Click to Enlarge
It looks like there maybe another 300 points at this part of the cycle. Though a wave four is looming the market could ignore it and just head to wave five. We see two wave fives and the second could also be reached. So all looks fine with this chart.
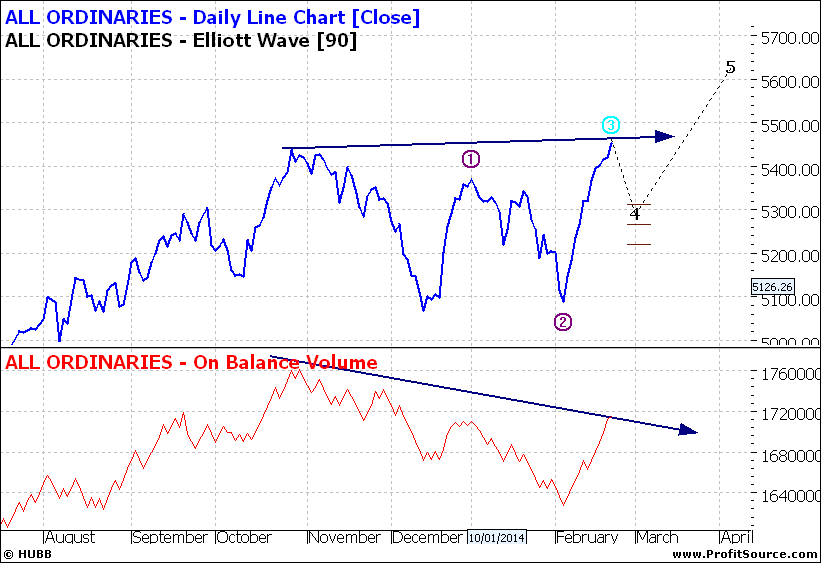
But do note that volume in the chart below is easing as we see here a negative divergence. Nothing serious at this point but it does mean that Institution are easing back and maybe tidying up their holdings whilst the retail investors are still all enthusiastic and buying like crazy in case they miss the boat.
Click to Enlarge
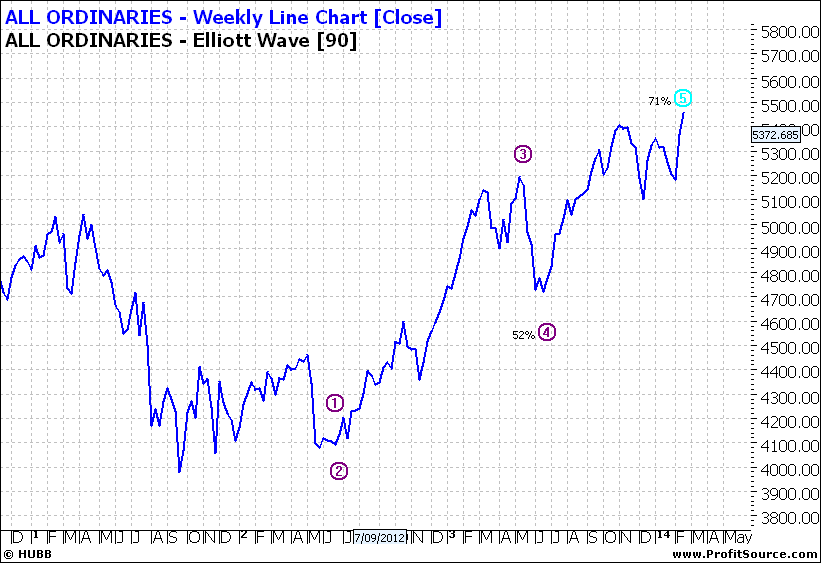
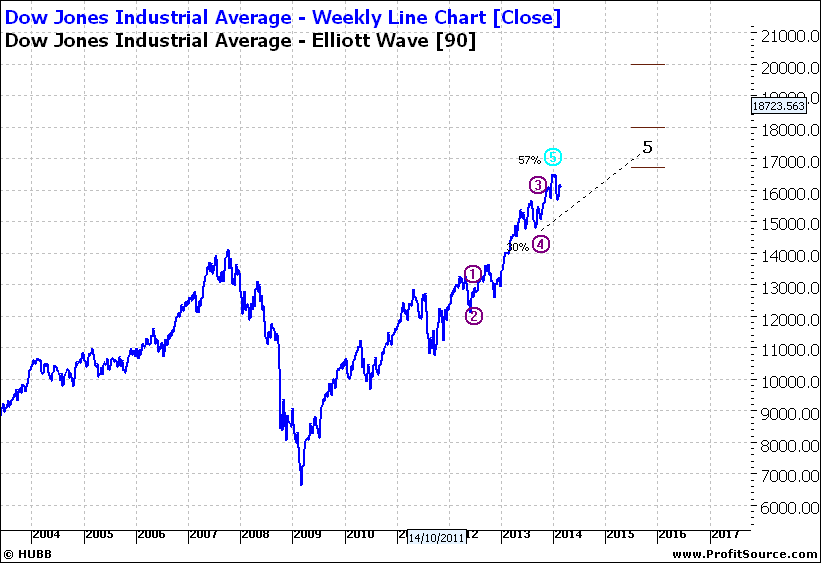
The next chart, a weekly, suggests wave five is not yet reached but that it is not far away:
Click to Enlarge
And the monthly chart reminds us that we are a still long way off the 2007 high:

Click to Enlarge
But it also says that the likely scenario going forward in relative terms, is the market drifting – well until there is a trigger to move it to and up or down trend. We know modern markets tend not to drift for long and that is partly because of the internet and frenetic moves with the likes of algorithm trading now tend to push markets one way or t’other. So they rarely just sit there.
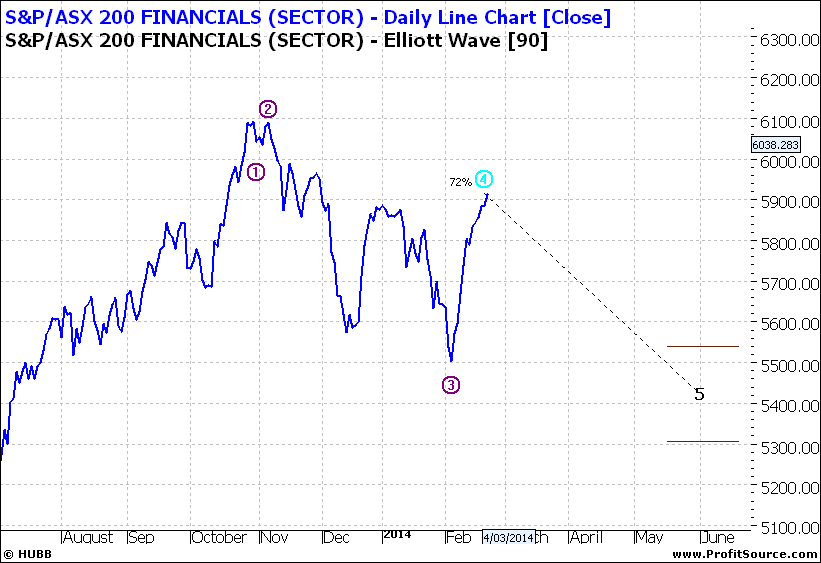
Short term there is some downside to Banks:
Click to Enlarge
But resource stocks look set for resurgence:
Click to Enlarge
But that is likely to have a limited life span:

Click to Enlarge
And in the meantime there is still great optimism in the USA:
Click to Enlarge
So no lurking dark clouds at the moment! But don’t turn your back.
Tom Scollon
Enjoy the ride
|