|
As I search for stocks and indices that might give me a clue about the outlook for resources I see little joy. Not massive pessimism. Just nothing that indicates we are likely to see a rise or trend develop in the foreseeable future. In fact you could read some indices as a proxy for the future and the story is that there is little further upside for the global economy or equity markets. But the risk of further downside.
The growth in global equities since 2008 has been from ‘over anxious’ money competing for few worthwhile opportunities. And in such circumstances money is thrown at ‘the next best thing’. Good or bad.
So here is a summary of global indicators. Most are weekly charts – but some daily. I sometimes choose daily – not to support my point of view but rather to show you a more likely scenario.
Light crude oil:
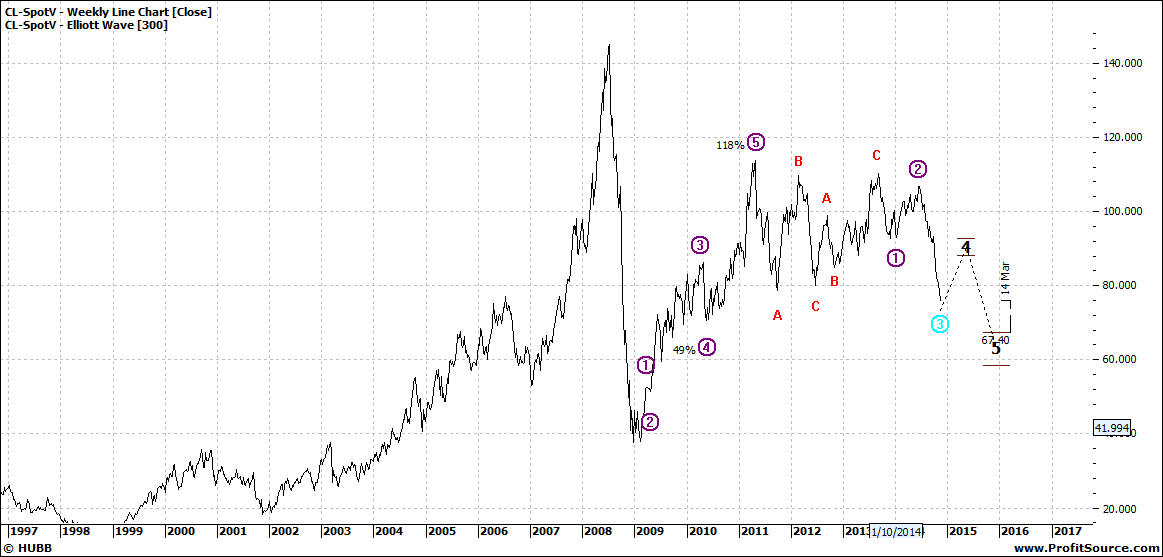
Click to Enlarge
Copper:
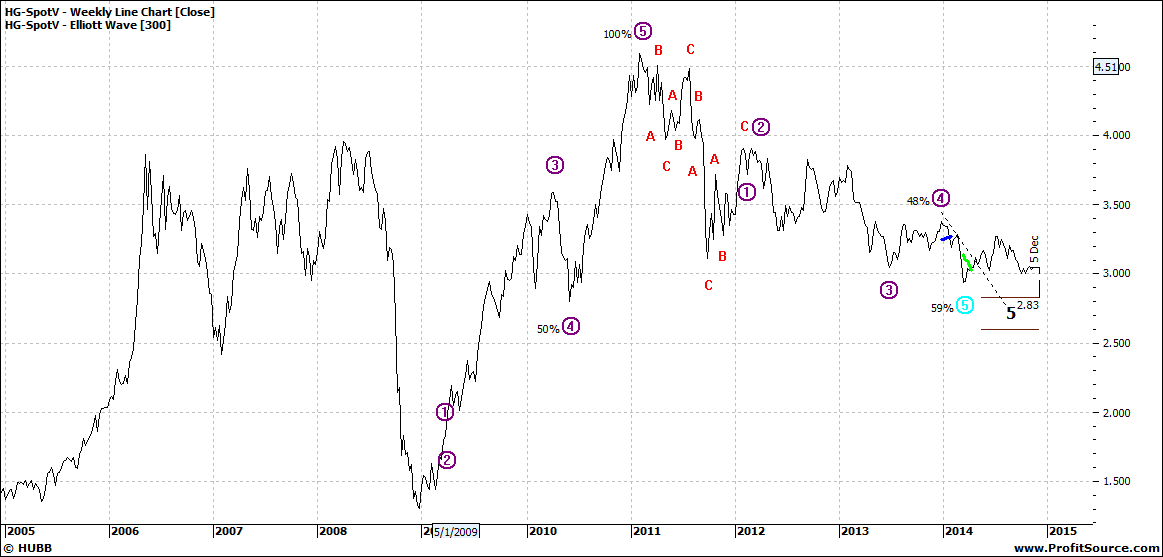
Click to Enlarge
Nickel:
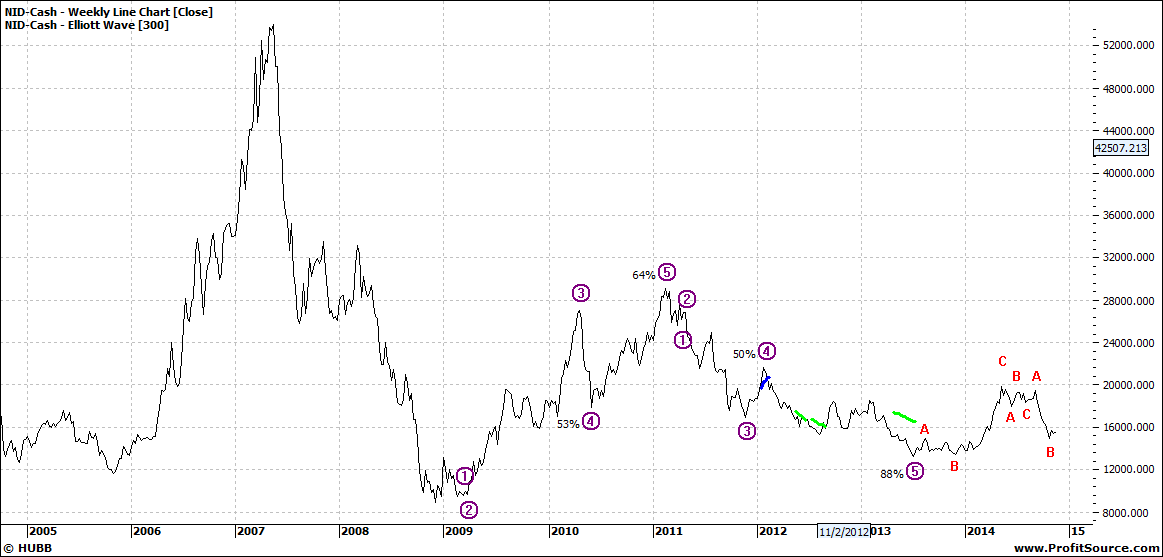
Click to Enlarge
Gold:
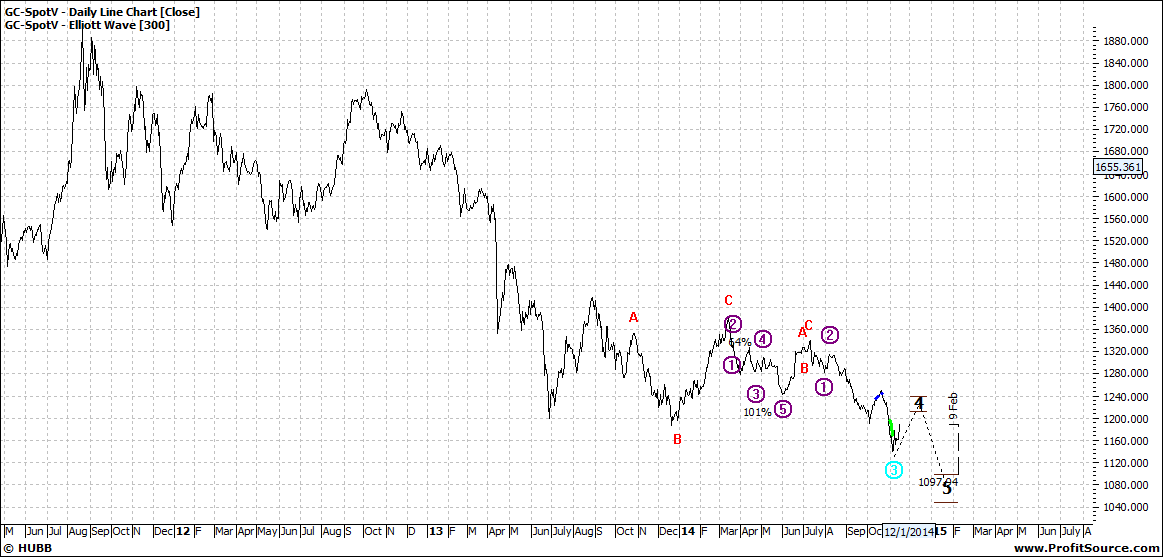
Click to Enlarge
Aust $
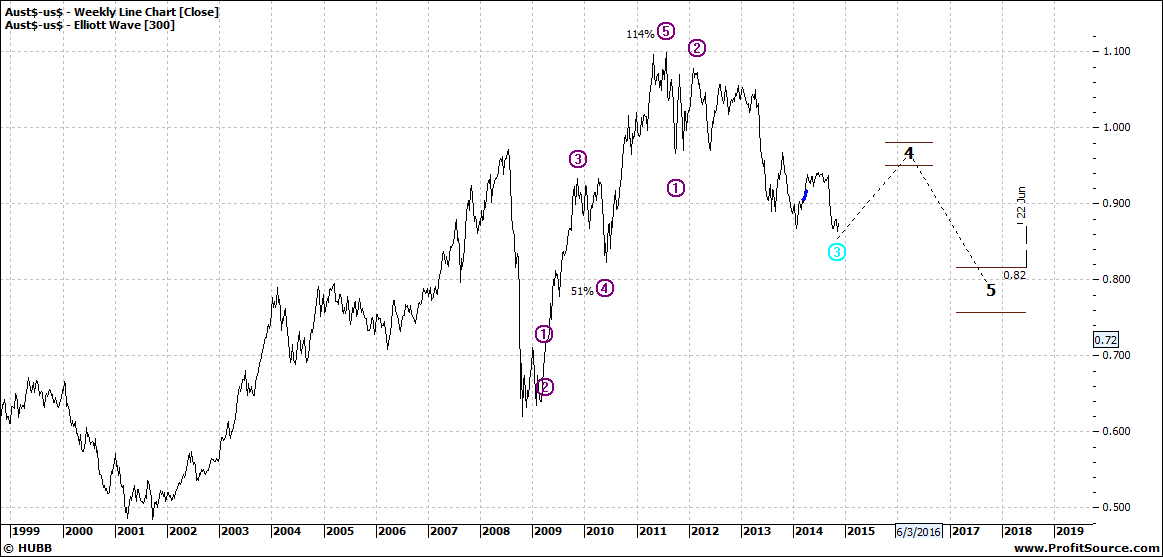
Click to Enlarge
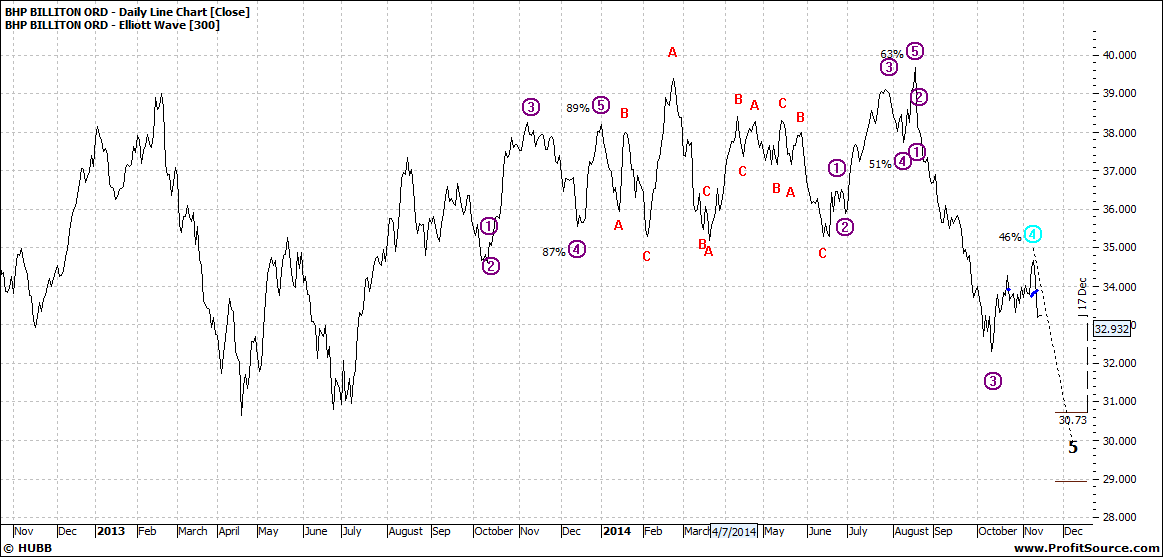
BHP:
Click to Enlarge
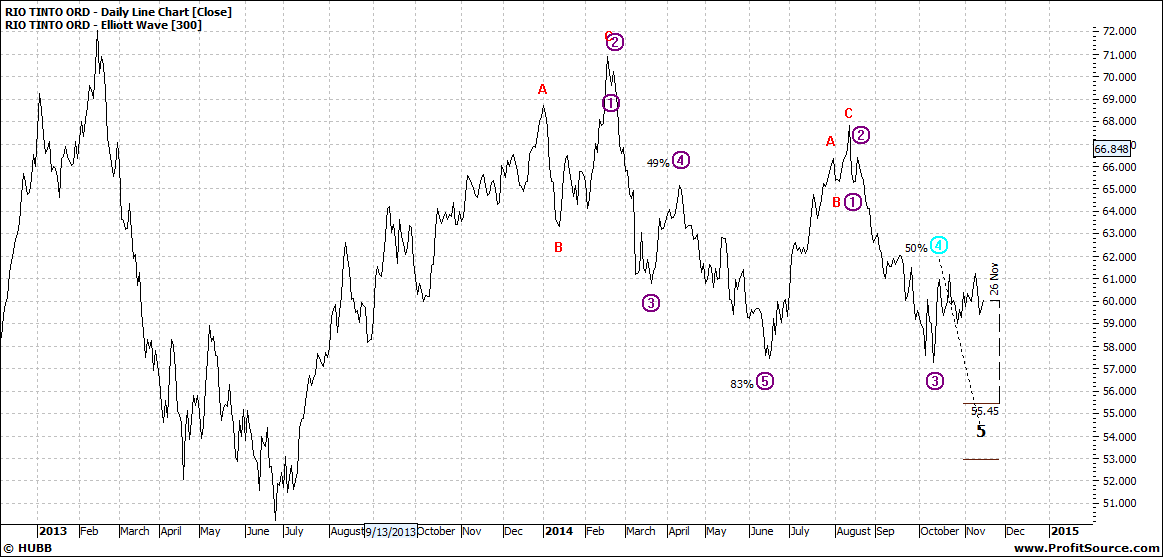
RIO:
Click to Enlarge
There is little comment required for specific charts as they all follow a similar path.
The Australian dollar weakness is consistent with the other charts as the dollar is very much tied to resources. As demand for resources rise so does the dollar as it is the resource currency. Overseas buyers scramble for the dollar to pay for imports from Australia. Right now there is a much reduced demand for resources so the demand for the dollar falls. In broad terms.
I don’t expect markets to fall over a cliff – yet. Nevertheless the momentum to the upside has run out of steam and when this happens – the risk turns to the downside.
When we cannot say, yet. But just keep your house in order.
Enjoy the ride
Tom Scollon |