|
If you know
the limbo rock then you truly are date stamping yourself. And nothing wrong with that. But you are also maybe asking yourself if you
should be reading stuff about the financial markets. Maybe you should be kicking your heels up in
The Bahamas and letting someone else look after your money. Maybe more about that another time.
To
BHP. Well the mantra of the limbo rock
was ‘how low can you go’ as party revellers eased themselves under the horizontal
bar, with head and back low and trailing behind under the bar.
Worldwide investors
are wondering how low BHP can fall.
No-one knows. Anyone who says
they know are only guessing.
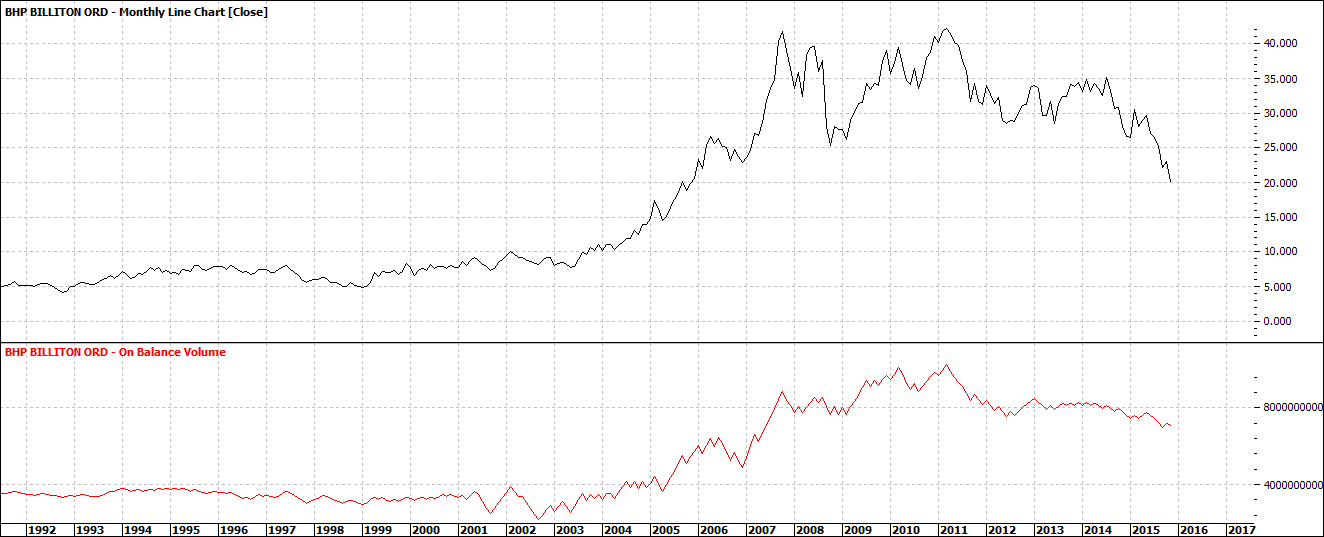
Let’s look
firstly at a Monthly chart:
Click to Enlarge
You can see
that BHP price is relatively high compared with the first ten years on the
chart.
With BHP we
also must remember that BHP has had many splits etc., over the years and it is hard
to know exactly that the original price equivalent is. Some analysts may know but for me, I am only interested
in the relativity. That is what the
price might do relative to today. Where
it may fall to and where it may recover to eventually. I think about finding the low for my own investment
portfolio. I hold no BHP though it has
been a long term favourite of mine. In
fact I have not held BHP for many years.
There are
two major factors at play for BHP one is the major and macro factor of global
demand for raw materials. And secondly
the micro factors – those that are BHP specific. It is the latter that has caused this latest
rout. Problems.
And we know
from experience that once there is a run on a stock or market rationality goes
out the window and price can be pushed well beyond what is reasonable. Whether BHP is well priced now I don’t
know. Does not matter to me. I just wait to see a low.
So back to
the chart. If you look at the first BHP
above and in particular the OBV indicator below price, we can see that OBV – On
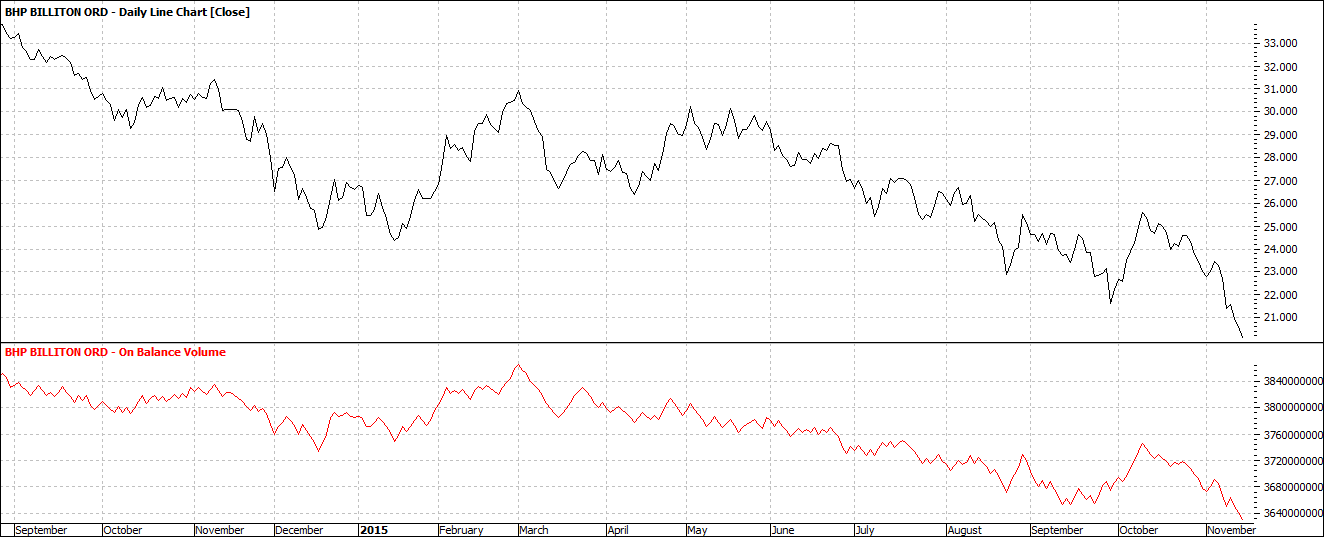
Balance Volume has held up well – relative to the last couple decades. If we look at a short term chart it looks
motherless:
Click to Enlarge
No-body’s
child.
My main
point of interest – probably like yours is when to buy. What price might that be at? And when.
I never expect
to buy at the lowest point. And I expect
that I will buy progressively over time.
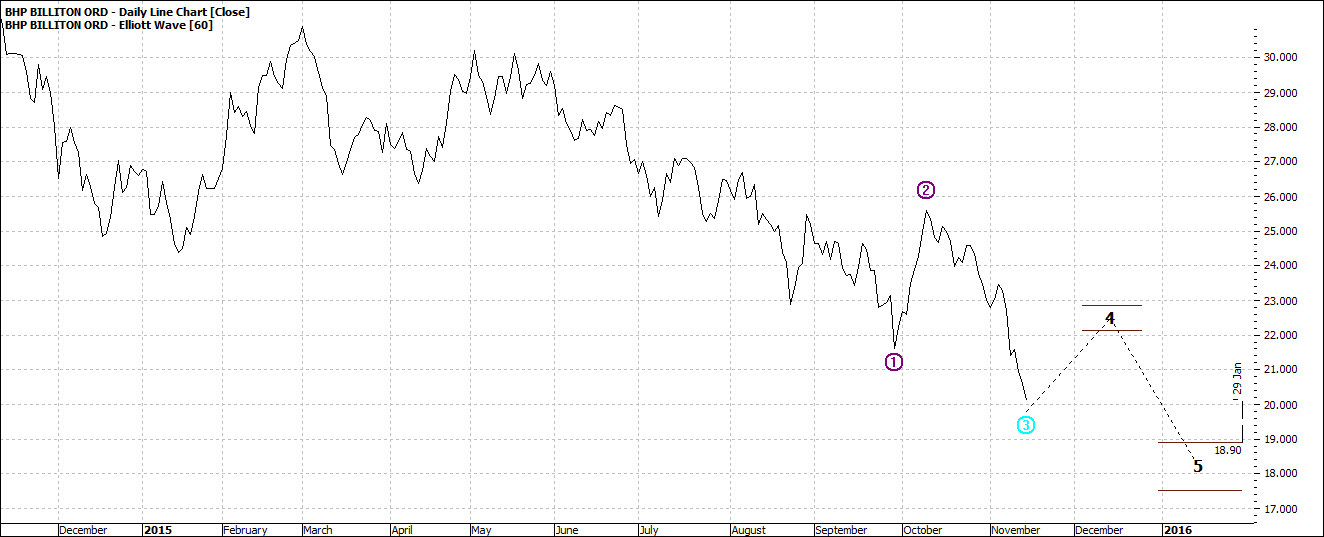
So I played
with some charts to think about what might lie ahead:
Click to Enlarge

Click to Enlarge
The first
chart is daily and suggests a low of $18/19 in January. That seems feasible to me. Maybe even before. Although the chart says, maybe a dead cat
bounce first. Maybe. Or maybe it goes straight to $18.
It nudged
below $20 this morning as I wrote. Down
over 11% for the week. Who predicted
that for this week? Anyone? Not I. So we
just don’t know. At the moment we can
only observe and speculate.
The weekly chart suggests maybe a low of $15
late 2017. Now $15 is a nice round
figure and markets also like them. 2017
is a long way away but somehow I muse. I
don’t think you will have to wait two years.
Enjoy the ride
Tom Scollon
|