
Well maybe the cleaners and a handful of customers.
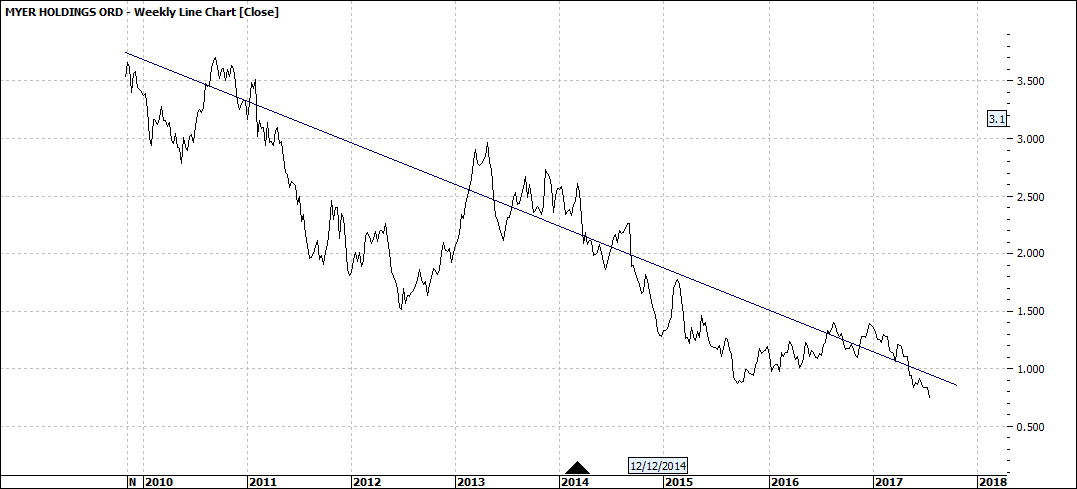
Performance of the share price has been nothing short of appalling. If you sent in the geese to manage the business they could have achieved what Myer has in the last several years:
Click to Enlarge
A few people got excited at times and punted that the sun would shine again, but this was not enough for a sustained momentum up and so the overall price trend has been down down down. I have heard that expression somewhere else.
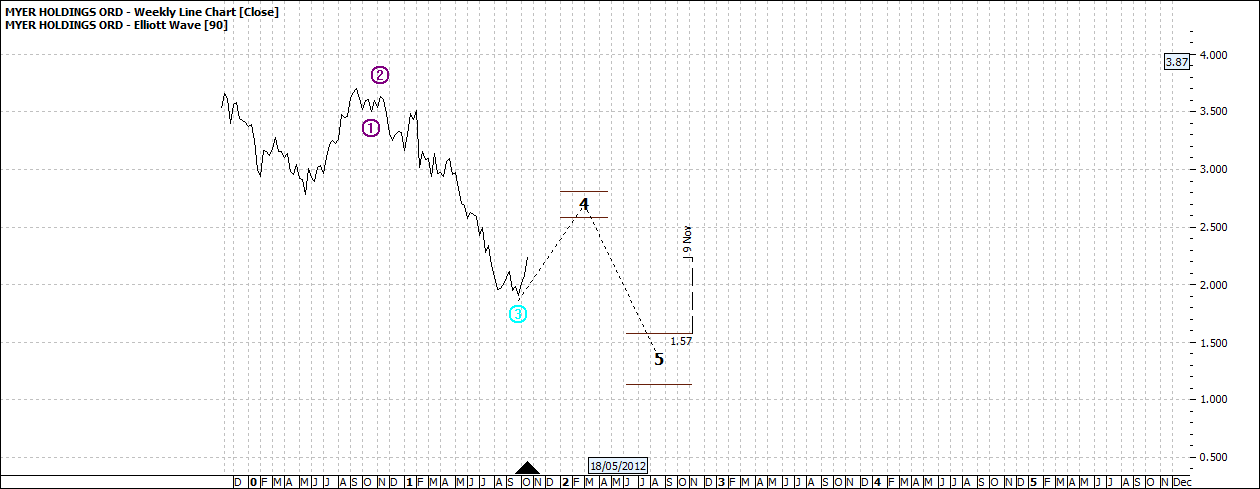
There have been many ProfitSource signals screaming at us that the share price was on a slide:
May 2012:
Click to Enlarge
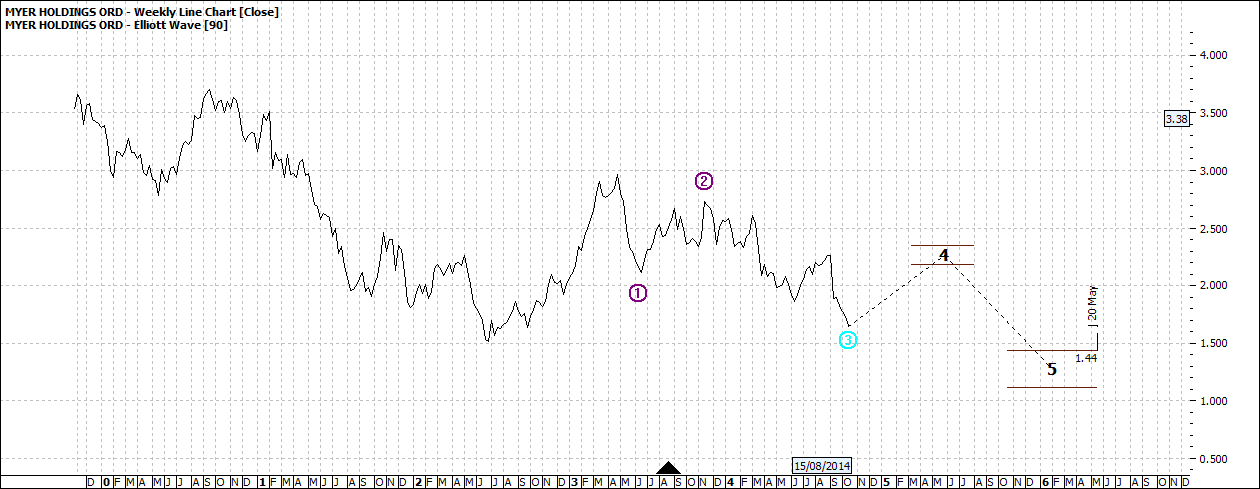
August 2014:
Click to Enlarge
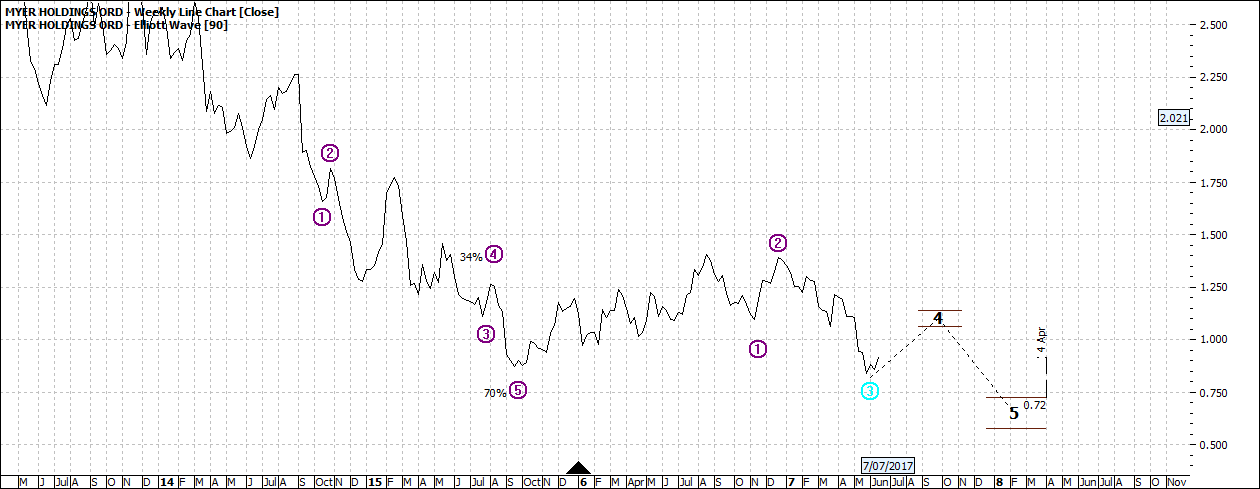
July 2017:
Click to Enlarge
The charts above I have taken from ProfitSource ‘Walk Thru feature’. This allows you to step back in time and see what sort of signals were being given at any point in time.
The charts are weekly but if I was to use a daily chart there would have been numerous other examples although many other weekly signals could also be easily found.
In each of the charts you can see the wave five projection. Interestingly in the last chart - in June 2017 the projected wave five was 72 cents - indicated for early 2018 but actually 72 cents was reached last Thursday.
So you might ask what is the lowest possible level? For me it is sort of academic as I have zero tolerance for such stocks. But my latest chart says:
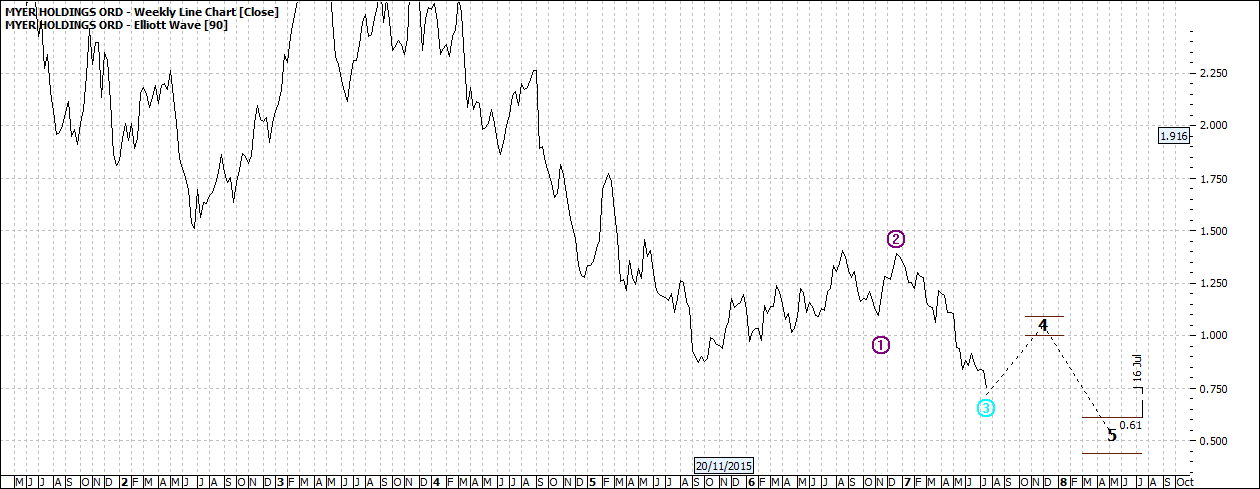
Click to Enlarge
Again first half 2018. In my experience slides come sooner than later and the gather momentum. We could turn to the fundamentals and ask what book value is Myer? Again sort of academic. We are into a new marketing paradigm - light years ahead of the Myer model of bricks and mortar which is a tough gig.
Maybe its value is land value. But wait a mo. 62 is the current projected low. It could be lower. Will it become a buy? Maybe as a short to medium play but as the gee gee racing guide says “better value elsewhere”
Enjoy the ride
Tom Scollon
|