
|
|
|
Some Random Global Brands
4, June 2018

From time to time I plan to look at global brand names and see how they are tracking.
I am starting this week with Alibaba a Chinese retail/IT giant that has seen phenomenal growth.
So, let’s look at a daily, weekly and monthly.
Because its meteoric rise has happened over a short few years we do not have long data history.
That matters little for the daily and weekly charts, but it permits a limited and qualified monthly outlook.
Daily:
|
|
|
AliBaba (BABA): Daily Line Chart
|
|
|
The daily shows the stock is in consolidation phase which is often a precursor to the next strong move – which could be up or down.
It is not dissimilar to the S&P:
|
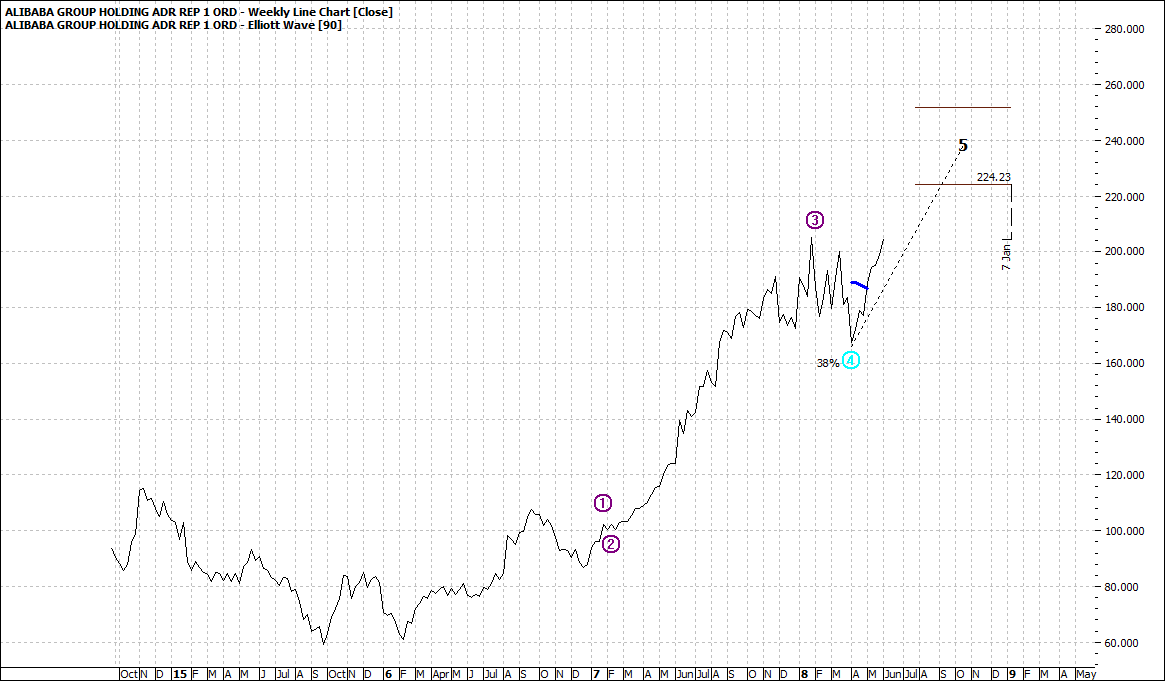
The Elliott projection is that the next move for Alibaba is in fact up: |
|
|
AliBaba (BABA): Weekly Line Chart
|
|
|
|
Click to Enlarge
The weekly chart ignores the daily machination and it says the current range trading is a mere dip in the continuing move higher and the projection suggests a high of perhaps around $250. So, if you bought the recent dip you would be looking at a gain of 40-50%.
Not too shabby.
And a mind-blowing return if you are long with options.
The monthly, with limited data, typically indicates a possible pullback:
|
|
|
|
|
AliBaba (BABA): Monthly Line Chart
|
|
|
This is to be expected, after, what will be a quadrupling of price over two years. It indicates a pullback by one third of the two-year move.
Monthly projections have a much lower probability than weekly and especially with limited data.
If you are half tempted to look for offshore diversification, then some of these upcoming analyses could give you food for thought
|
|
Enjoy the ride
Tom Scollon
|
|
|
|
|
|
|