
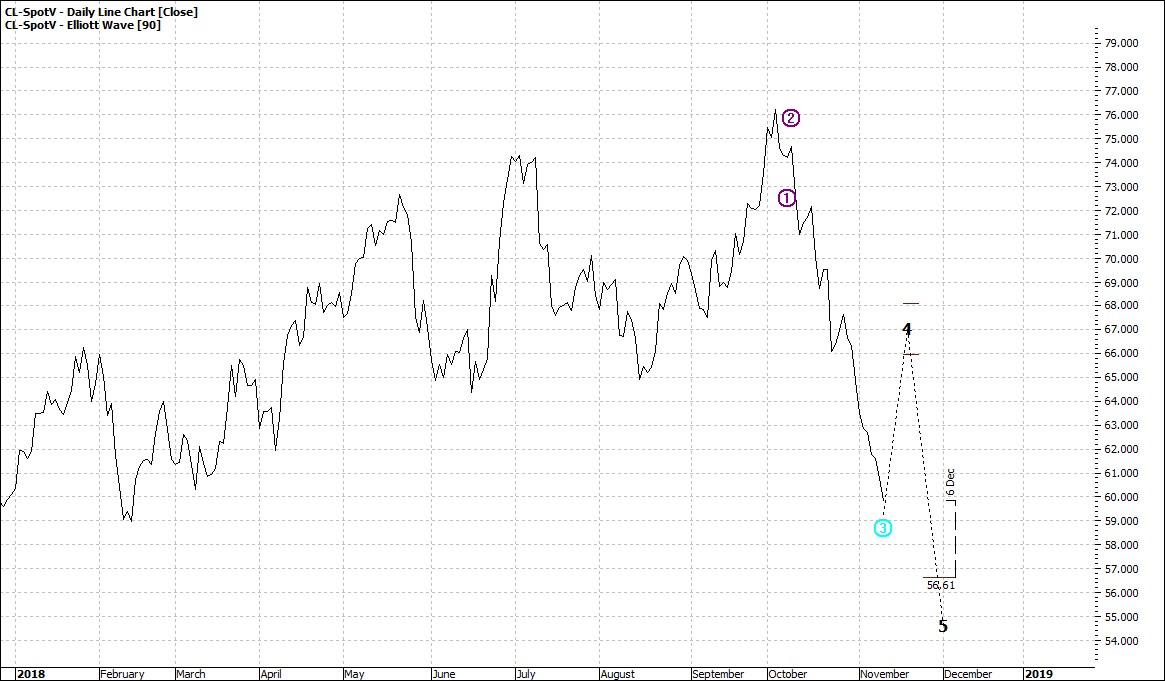
Light crude looks pretty sick:
|
Light Crude Oil (CL-SpotV:NYMX): Daily Line Chart
|
|
|
Click to Enlarge
And yes, we are likely to see further falls as per the daily.
|
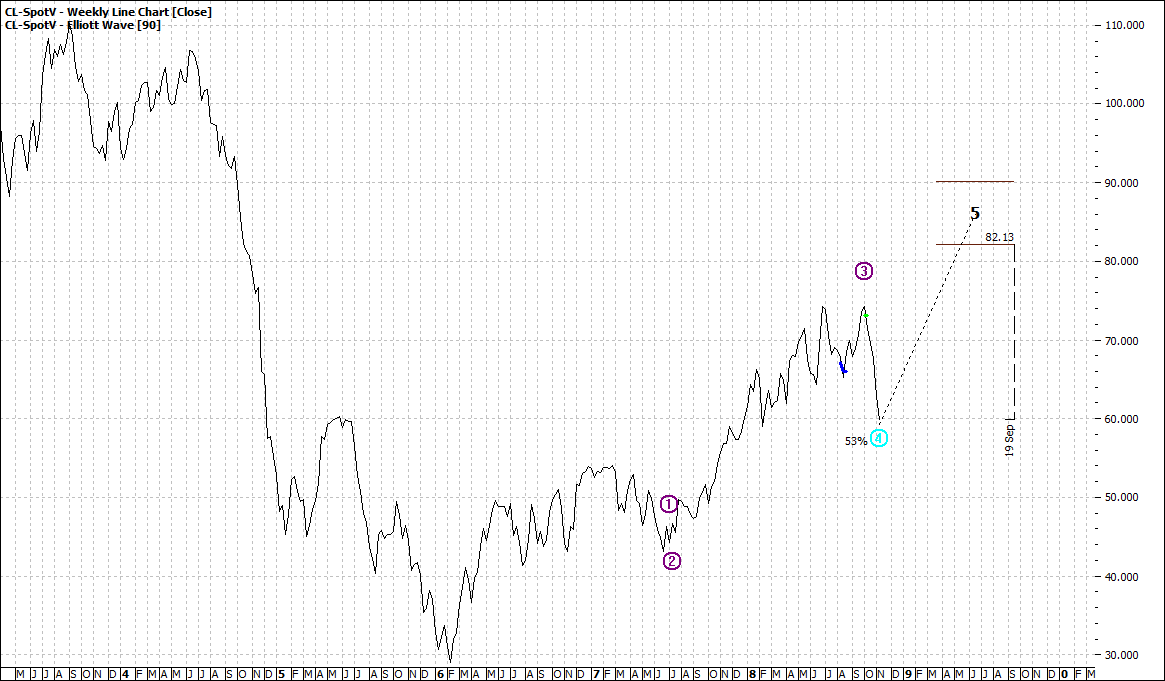
Light Crude Oil (CL-Spotv:NYMX): Weekly Line Chart
|
|
|
Click to Enlarge
The weekly says a solid rise is around the corner
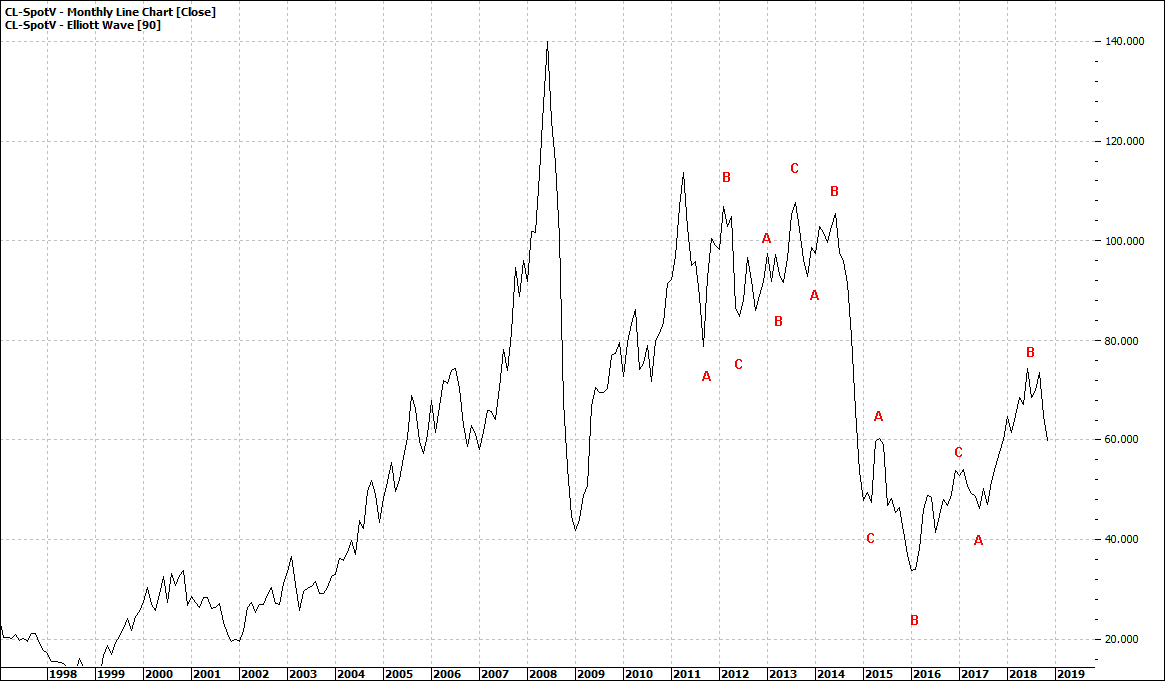
And the monthly says "I don’t know"...
|
Light Crude Oil (CL-Spotv:NYMX): Monthly Line Chart
|
|
|
Click to Enlarge
So, what do you make of these mixed messages?
One of the problems with oil is that it is not what we would call, in economic theory, a perfect market – a perfect market being many buyers and sellers.
Keynesian economics did not deal much with the concept of collusion or cartels although it did imply that such ideas would work against a perfect market.
The reality today is that – despite laws outlawing collusion – some markets are controlled.
The price of oil is controlled by agreements on production. Against the law but the major oil producers are party to such agreements.
So not only does economic theory get messed up when price is managed but so does technical analysis get challenged.
However, I must say that technical analysis handles it well and it will suggest something different from what OPEC agrees.
In the real world some parties to the OPEC agreement will go off and do their own thing. They may agree at the summit to cut production, but as soon as they get back home they will produce just as they want – for national/economic/political reasons.
So, in effect what we see in the charts is reliable.
In summary we will see some further softening of price. If price falls deeply the weekly chart will change its mind and the projected wave five may not happen as projected but rather fizzle out. The market may go higher but it could well be a failed wave five.
And long term?
Well light crude is like so many other key indicators of global growth.
The monthly chart is somehow doubting that the next few years will be bullish.
No surprise
Enjoy the ride
Tom Scollon
|