
Much drama and publicity surrounding the DOW.
And many big questions being asked across the globe on a host of matters.
New order issues which we have not seen before as we are flashing through a new era timeline.
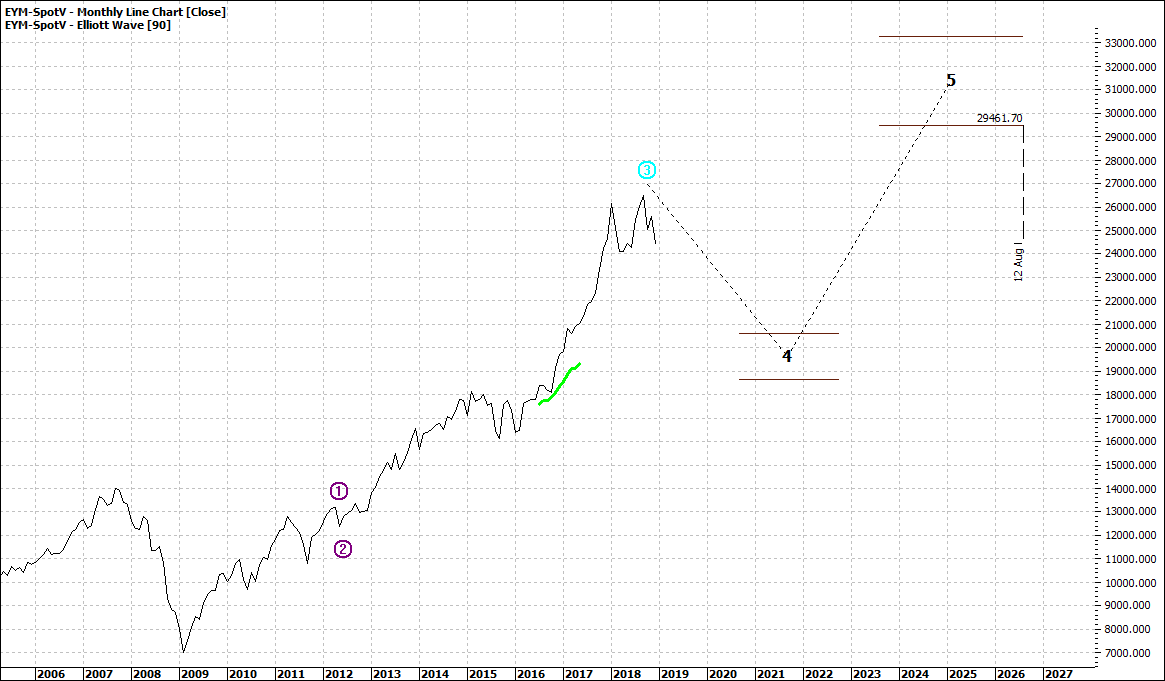
Let’s look at the big picture for the DOW – the monthly:
|
Dow Jones Futures (EYM-SPOTV): Monthly Line Chart
|
|
|
Click to Enlarge
What we have seen so far in this retreat is a move back to levels of a year ago.
Not into bear territory as some pundits suggest.
What this chart proposes is an orderly wave four pullback which we have not seen in a decade, for the USA.
Now we have to qualify that by saying that the monthly chart is a very big picture. It is four years out on this chart. That is a long time in this modern era.
Anything can happen in that time frame.
We live in a frenetic world and what may have taken a decade to happen for the last generation, may only take a couple of years.
We truly are moving at lightning pace.
But I do think that monthly charts can give us a glimpse.
Not a complete picture but it does highlight possibilities and times to be wary.
A pullback as shown above would be about 33% or so – with out using retracement tools. That is very orderly in terms of volatility and a long way from going over a cliff.
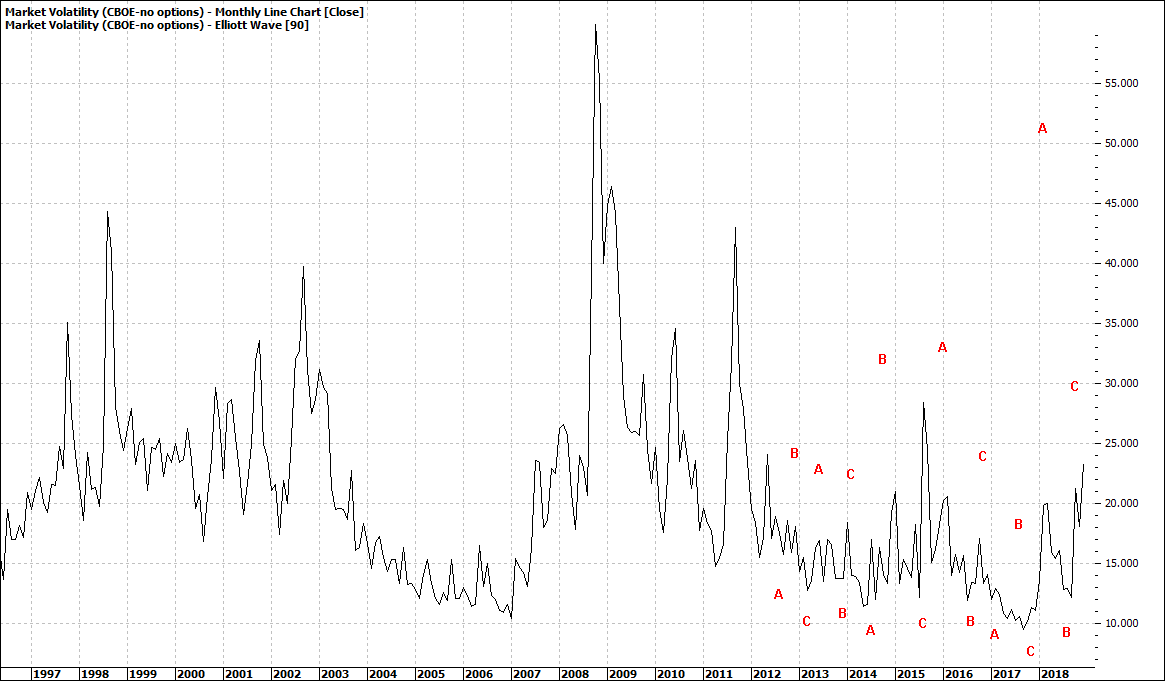
The VIX – volatility index – is now hitting the headlines again:
|
CBOE Volatility Index (VIX:CBOE): Monthly Line Chart
|
|
|
Click to Enlarge
In relative terms it is not too scary either.
Investors are not screaming to the exit.
All of this could change, but for now it seems we are a bit away from any capitulation
dead.
Enjoy the ride
Tom Scollon
|