
Well the XAO charts seem to think so, at least in Oz.
Though you and others may not think so.
None of the charts below look too concerning.
The Santa rally which yours truly did not expect, has in fact continued well into January.
Let's look at the charts – the usual daily, weekly and monthly:
|
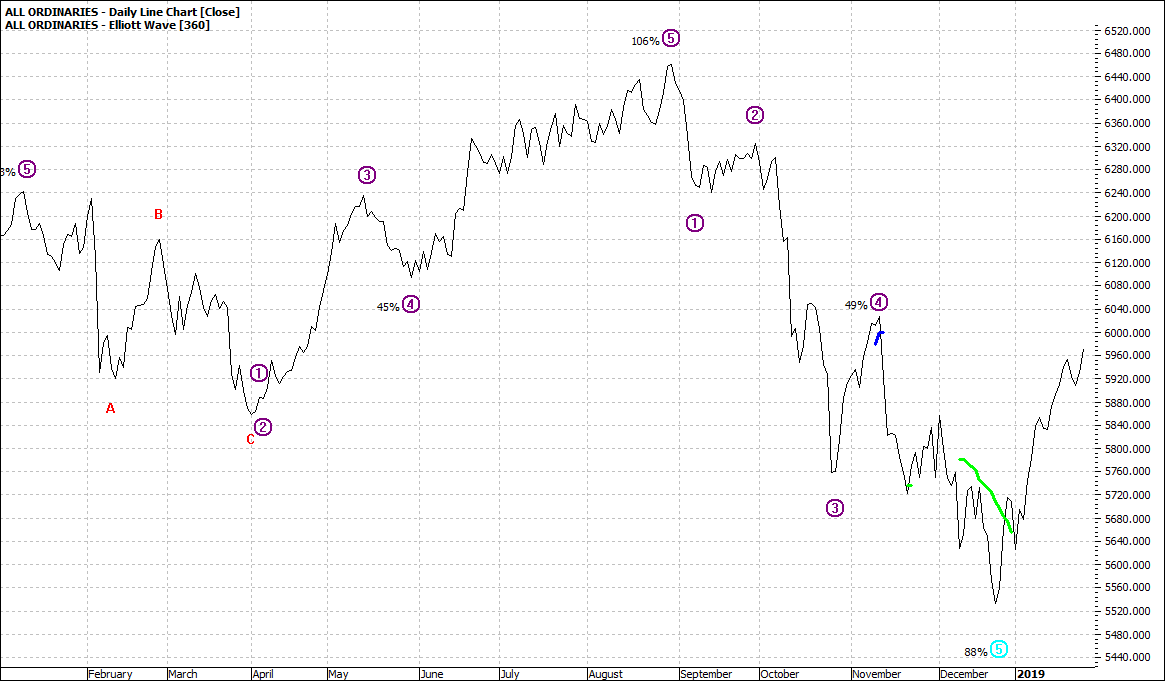
All Ordinaries (XAO:ASX): Daily Line Chart
|
|
|
Click to Enlarge
|
All Ordinaries (XAO:ASX): Weekly Line Chart
|
|
|

Click to Enlarge
|
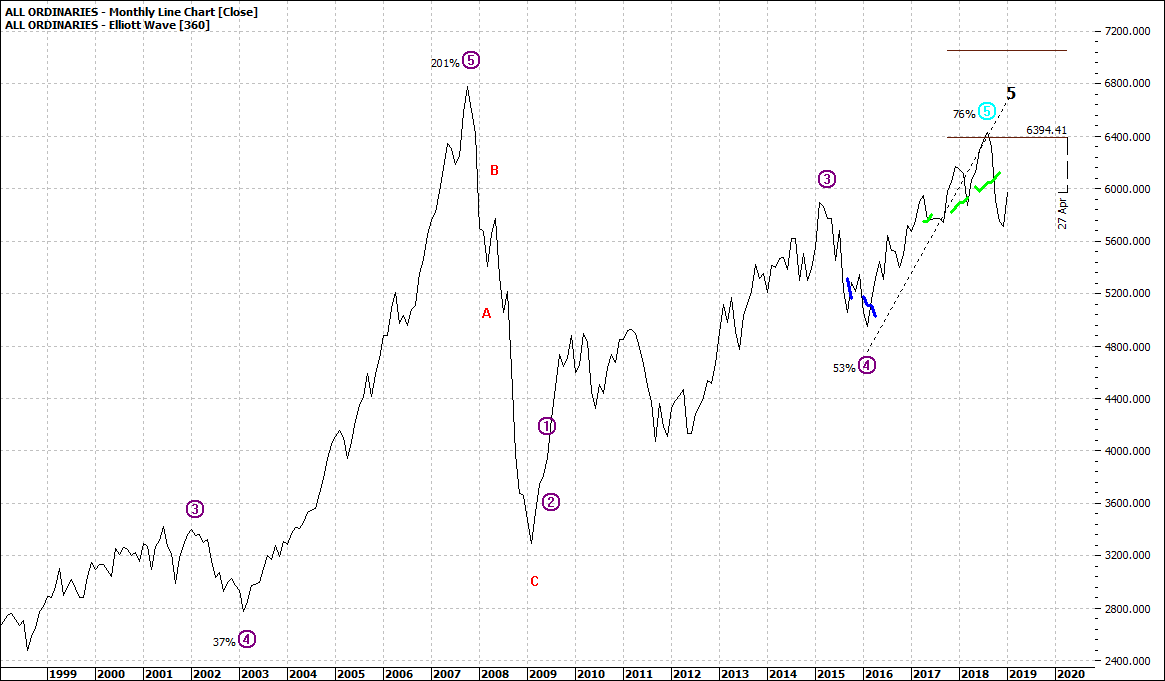
All Ordinaries (XAO:ASX): Monthly Line Chart
|
|
|
Click to Enlarge
The daily does indicate the Wave five low is not yet complete.
Caveat emptor, though it could be complete.
The weekly chart says we will cruise for a while.
And the monthly does leave open the prospect of a second wave five high – over the next couple of years.
None of these charts indicate a strong trend in the making.
Maybe we have to wait for another couple of weeks or more to see if a clearer picture will emerge.
Enjoy the ride
Tom Scollon
|