
If your portfolios were tracking the Australian All Ords you would be reasonably happy with yourself:
|
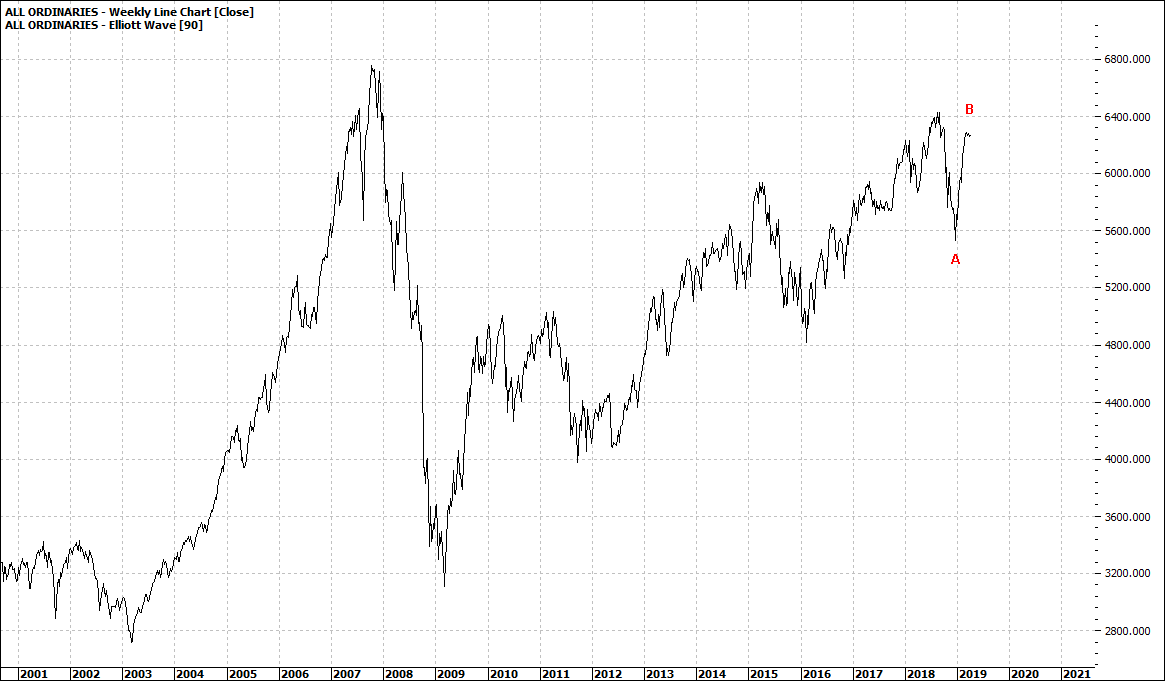
All Ordinaries (XAO:ASX): Weekly Line Chart
|
|
|
Click to Enlarge
Up and down, but overall up – bumpy as the ride might have been.
The Financials on the other hand has been quite sickly over the last couple of years:
|
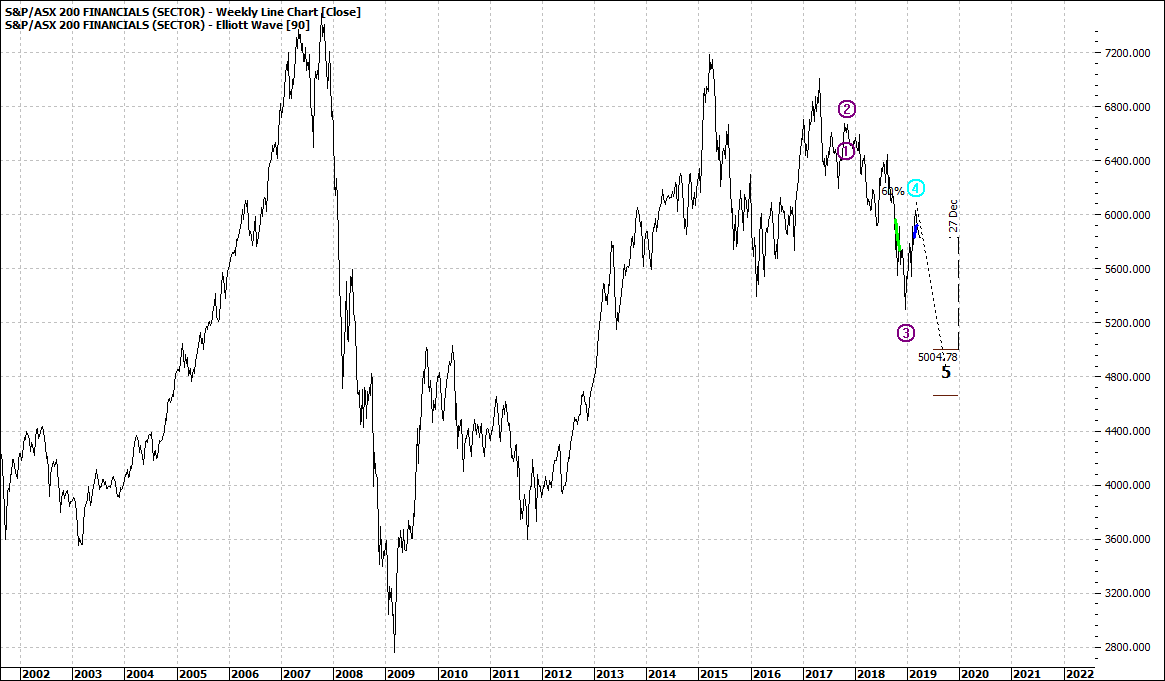
S&P ASX Financials (XFJ:ASX): Weekly Line Chart
|
|
|
Click to Enlarge
The index
was making a fast track to the old 2007 high but had a sudden fall from
grace and though we have seen a recovery since December 2018 it appears
there is the possibility of further downside.
The index makes up 30% of the overall market and likely to be over half of retiree’s portfolio. Low interest rates and poor performing banks is not a nice combo.
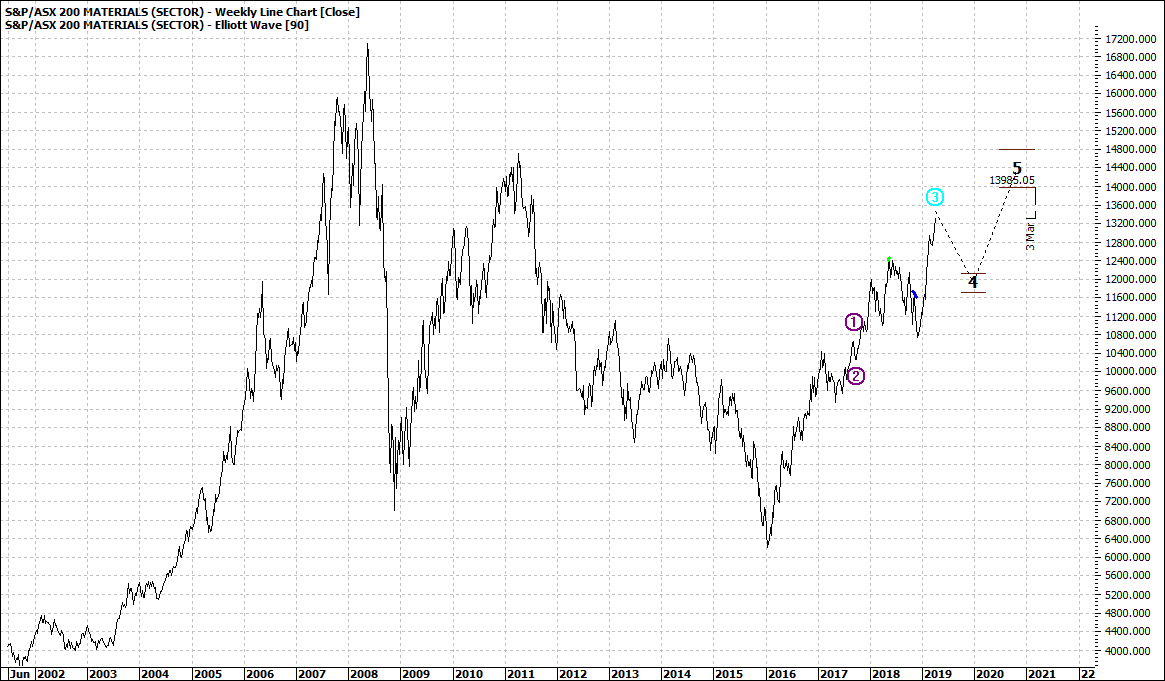
Materials (resources) on the other hand have done well over the last 2-3 years.
|
S&P ASX Materials (XMJ:ASX): Monthly Line Chart
|
|
|
Click to Enlarge
At a little under 20% of the overall index, Materials has not been a traditional favourite of some investors and certainly not as popular as banking for the majority of retail investors. A simple layman view might be that it is a risky, volatile sector and most will have heard many tales of rags to riches or even rags to rags. Of course the sector is less in the hands of Australia’s control as it is very much dependent on the global economy and that can be anyone’s guess sometimes and thus has always felt a little out of reach.
If you look at the three charts in summary one can’t help but notice that the last few years have been somewhat difficult to pick. Not so much the sector, but rather getting timing right. And for the vast majority of investors fine tuning sector buying and selling is well out of reach – and even for the Instos.
So typically investors ride the waves and shake their heads.
Enjoy the ride
Tom Scollon
|