
Fearlessly, confidently, defiantly markets march to the top – without really knowing where the top is.
Let’s look at key indices that are typically of interest to Hubb clients – the DOW, S&P and the XAO – daily and then monthly:
|
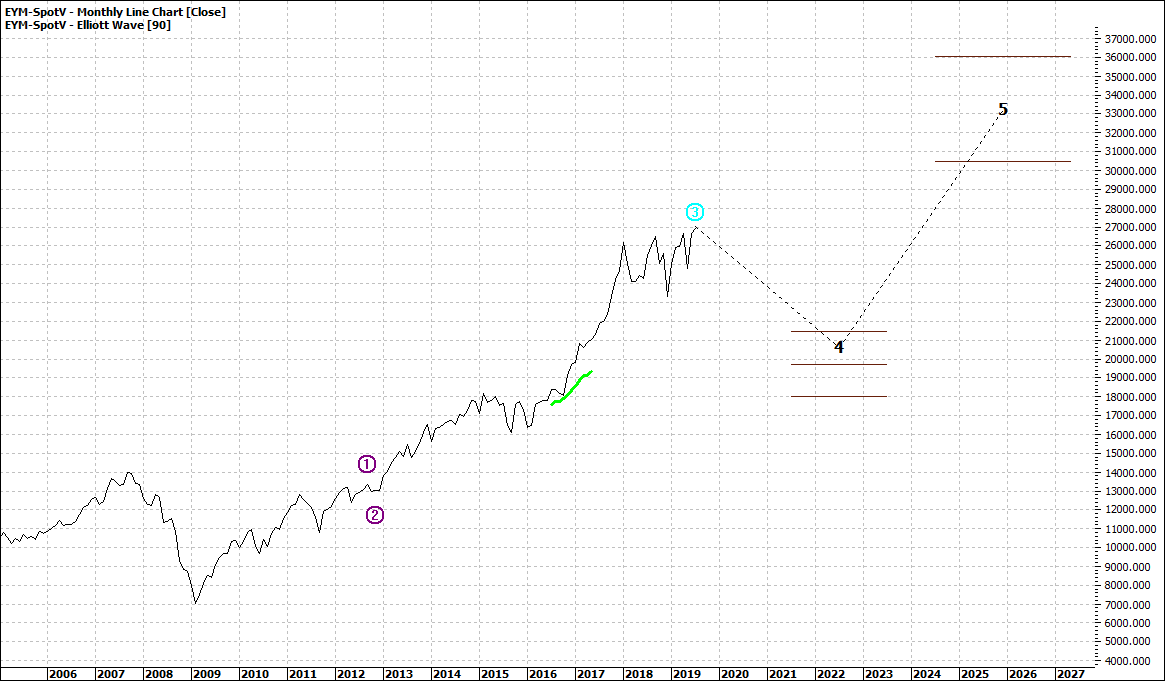
Dow Jones Futures (EYM-Spotv): Daily Line Chart
|
|
|

Click to Enlarge
|
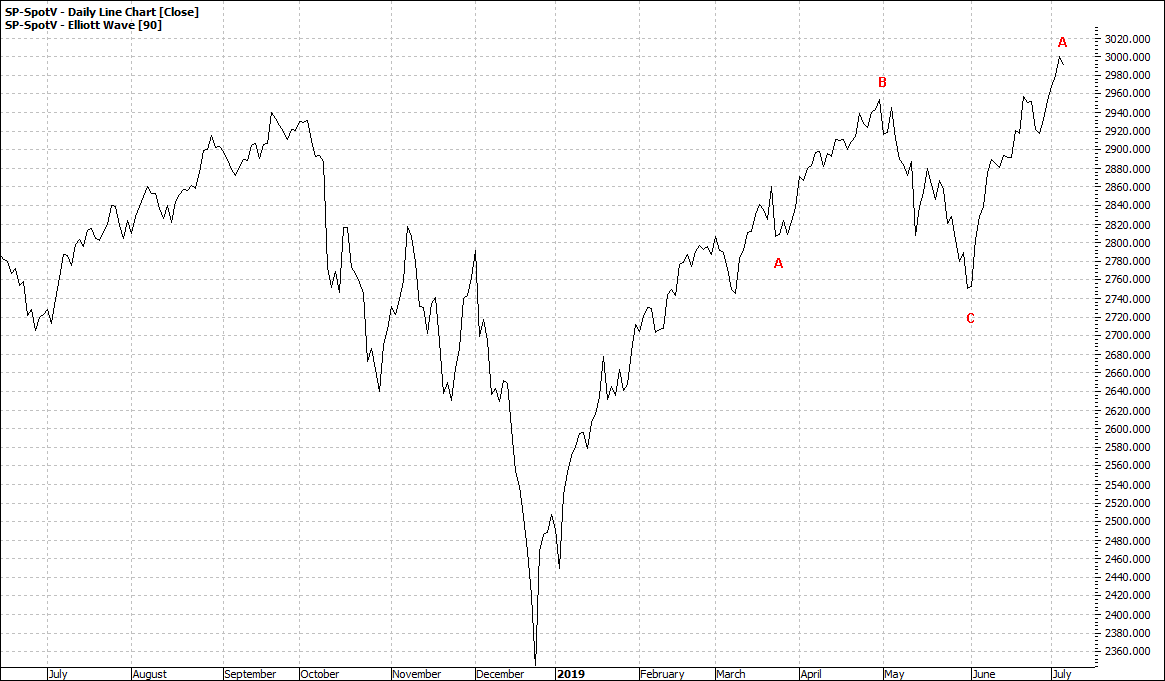
S&P 500 Futures (SP-Spotv): Daily Line Chart
|
|
|
Click to Enlarge
|
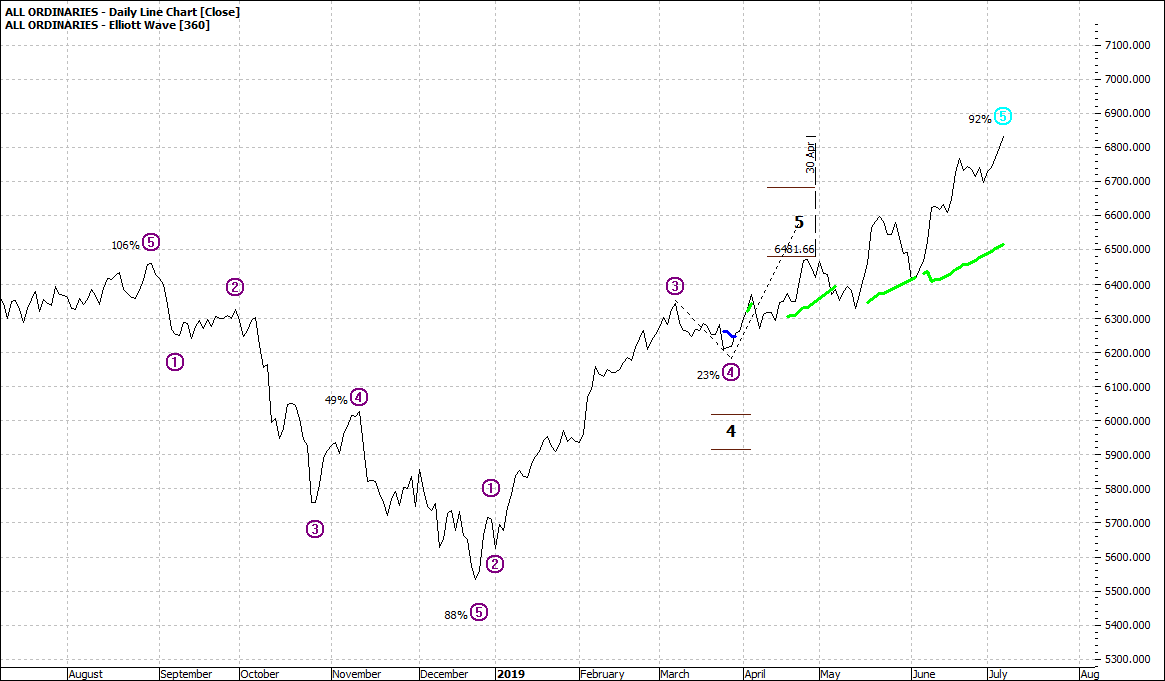
All Ordinaries (XAO:ASX) Daily Line Chart
|
|
|
Click to Enlarge
|
Dow Jones Futures (EYM-Spotv) Monthly Line Chart
|
|
|
Click to Enlarge
|
S&P 500 Futures (SP-Spotv) Monthly Line Chart
|
|
|

Click to Enlarge
|
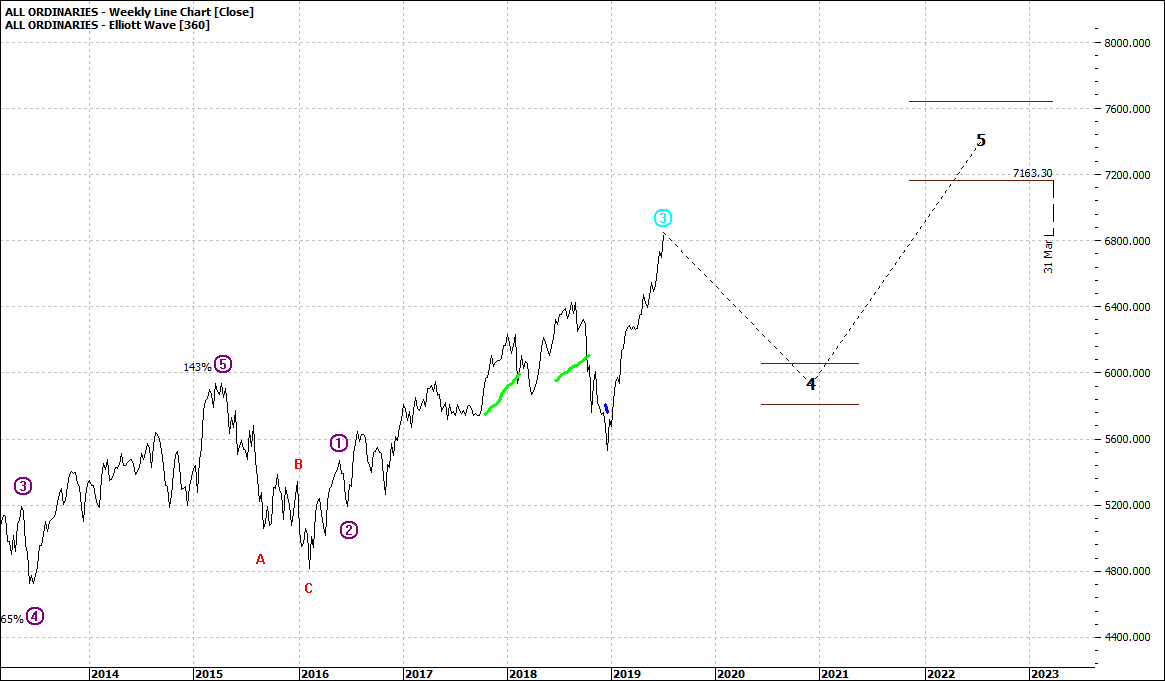
All Ordinaries (XAO:ASX) Monthly Line Chart
|
|
|
Click to Enlarge
A lot of charts but a simple flow of charts and ideas.
The journey to this steep high has been different for each market but in general we have seen a fully charged bolt and now a pause as both buyers and sellers take a breather before the next move. So, we see an ABC pattern.
The weekly charts show a similar pattern so for the S&P and the DOW I have looked at the monthly chart – very big picture.
In the case of the XAO I am actually using a weekly as the monthly tells us little.
In all three we see a warning that a wave four is somewhere ahead. It does not look threatening at this point, but we do know that ‘X’ factors can turn all this upside down.
We also know that markets can climb higher despite being in a sideways mode.
Without doubt markets look strong and little points to a sudden drop over the edge.
And of course, we all know without looking at a chart that there will be a retreat. Regardless there will be some victims. Timing is always the big unknown.
No cause for fear.
Do not be afraid, just keep a minds eye open.
It is always good to remind ourselves of such plain vanilla scenarios.
Enjoy the ride
Tom Scollon
|