
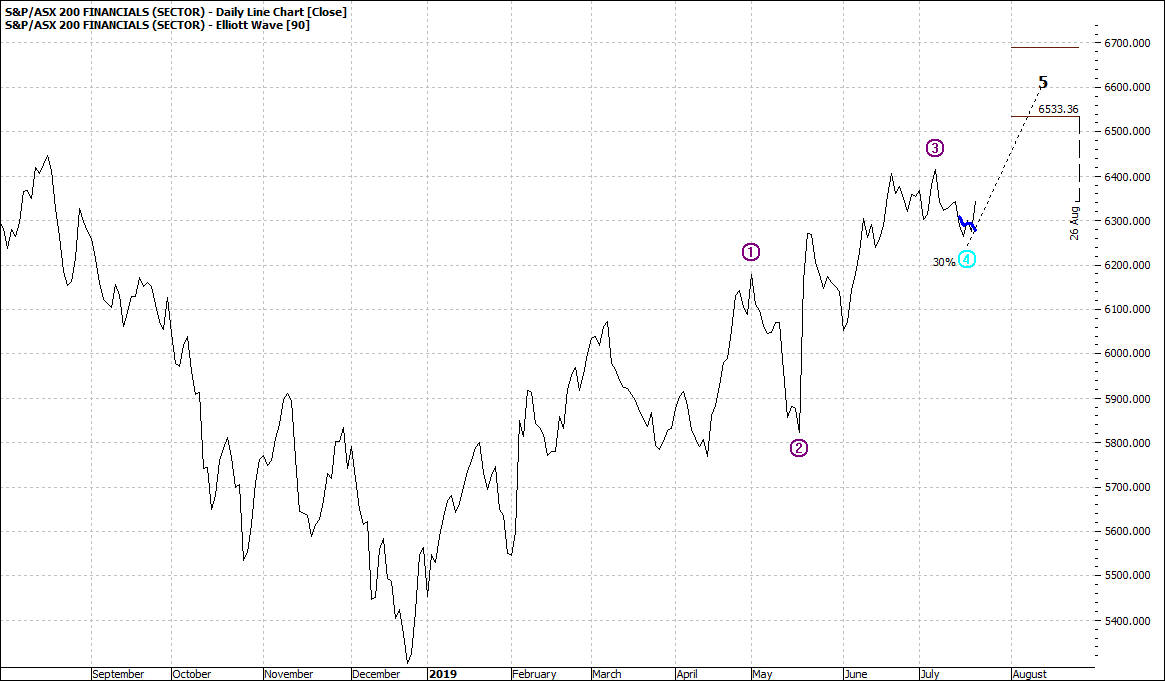
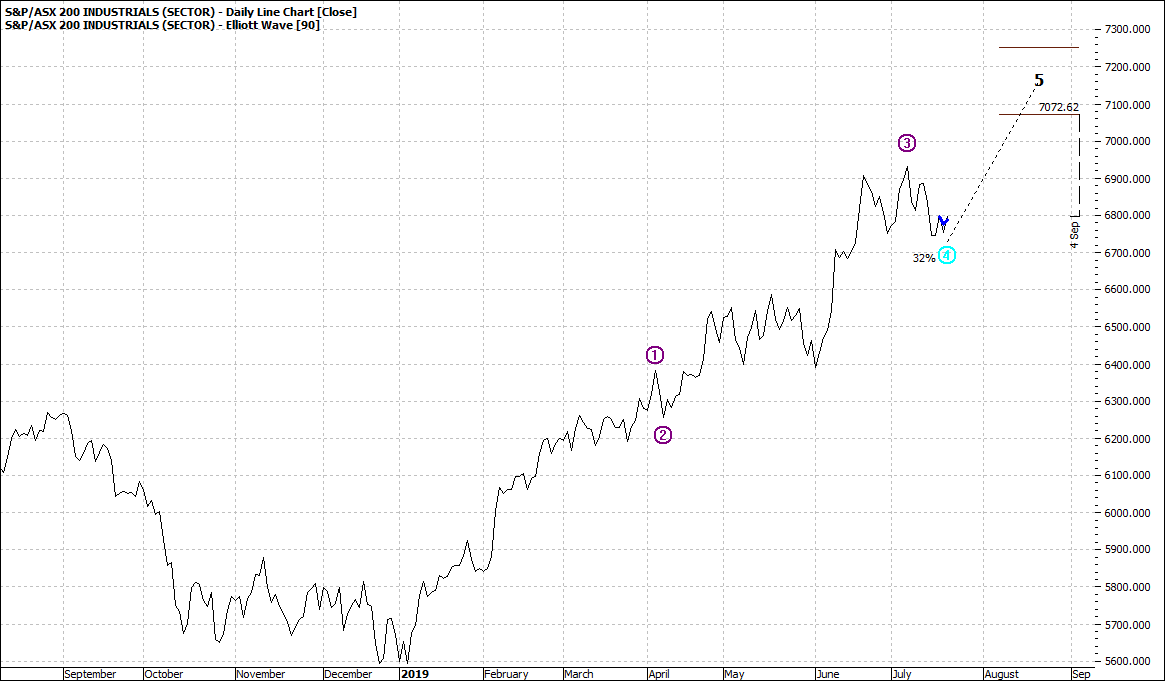
The XFJ – principally banks, make up about 40% of the All Ords and the XNJ – Industrials about 8% - so almost half the local market between the two sectors.
Take a look at the chart for each:
|
S&P/ASX 200 Financials (XFJ:ASX): Daily Line Chart
|
|
Click to Enlarge
|
S&P/ASX 200 Industrials (XNJ:ASX): Daily Line Chart
|
|
Click to Enlarge
Both are going into wave five with about 10% to go to the wave five range. Some individual stocks will do better, others not so well. But on average both sectors look strong.
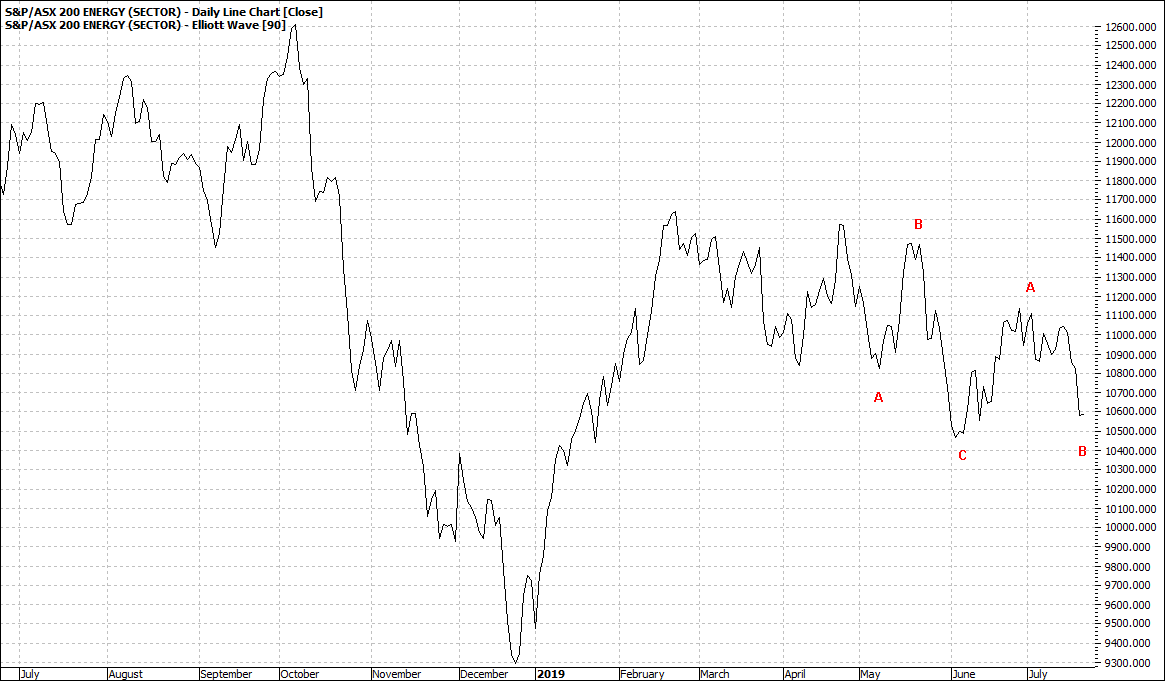
Energy is lack lustre and attracting little interest despite some analysts talking it up:
|
S&P/ASX 200 Energy (XEJ:ASX) Daily Line Chart
|
|
Click to Enlarge
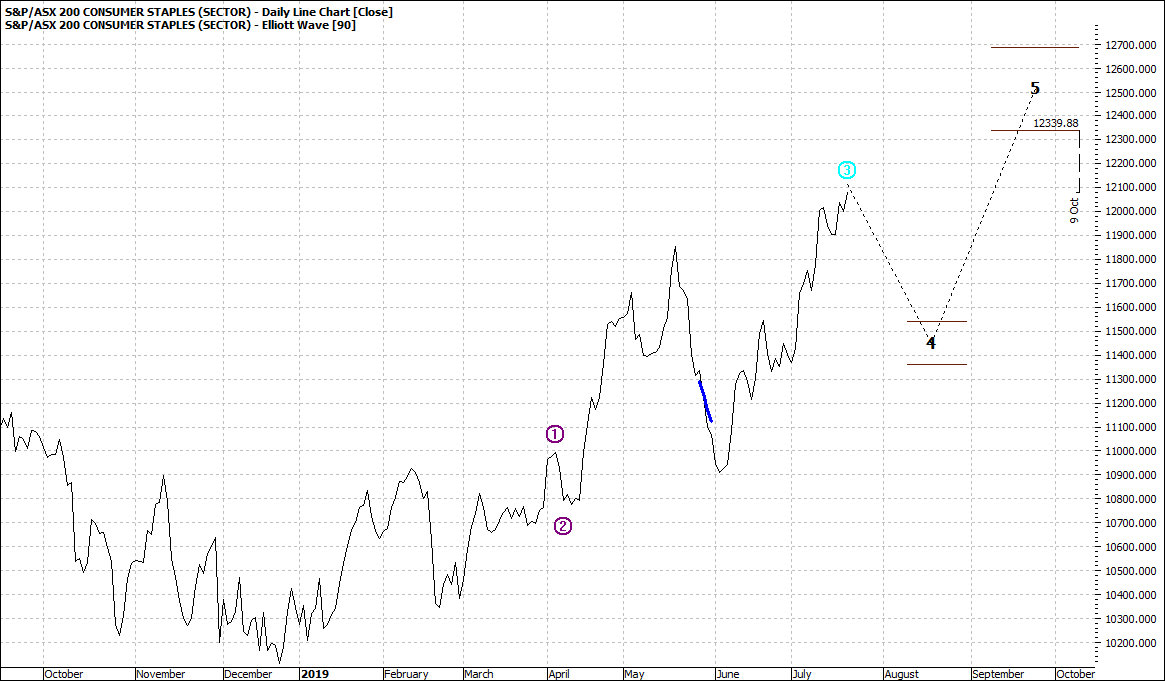
XSJ – consumer staples – our daily bread will head higher, but we also see a wave four pullback looming:
|
S&P/ASX 200 Consumer Staples (XSJ:ASX) Daily Line Chart
|
|
Click to Enlarge
Our discretionary spending is faltering – that is, we are holding back on fancy goods expenditure.
Materials – XMJ – are making only a small contribution to the push higher:
|
S&P ASX 200 Materials (XMJ:ASX) Daily Line Chart
|
|
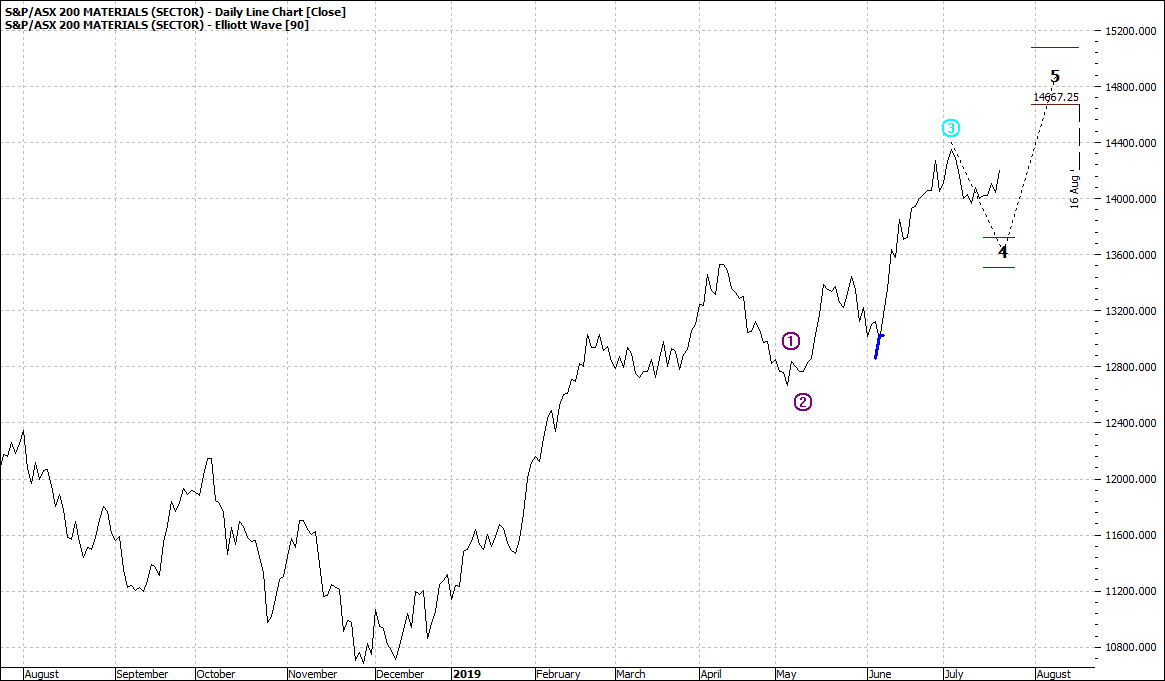
Click to Enlarge
ALSO
There is a caveat. The All Ords Weekly:
|
All Ordinaries (XAO:ASX) Weekly Line Chart
|
|
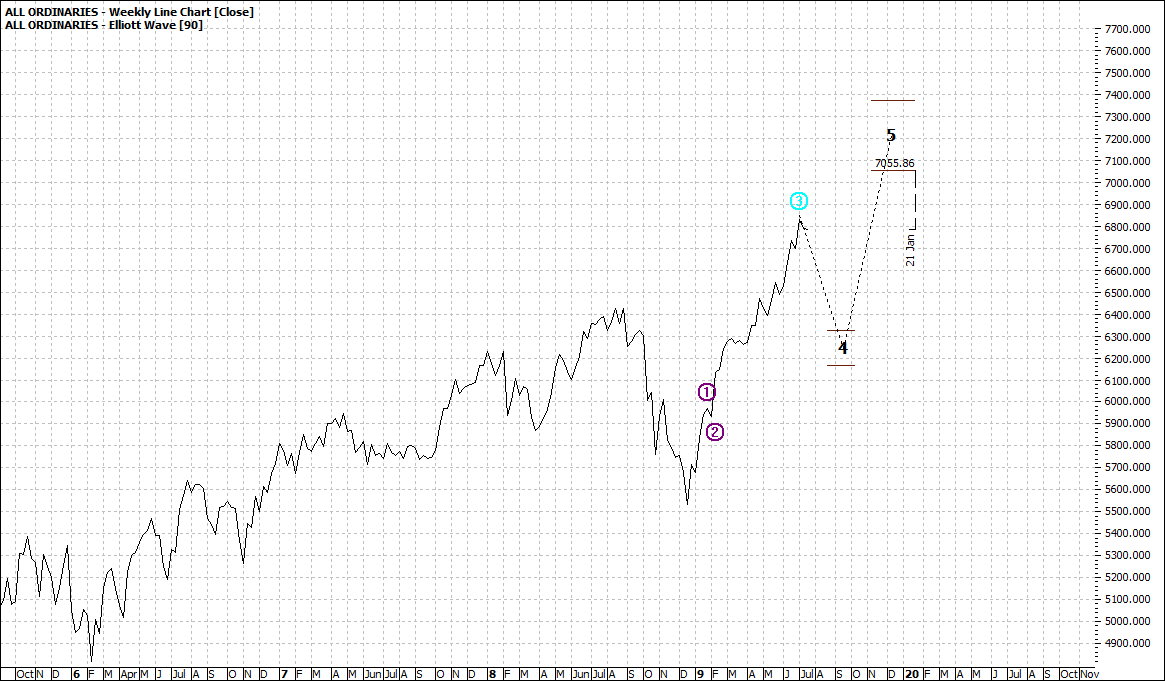
Click to Enlarge
Yes, we are more than likely to see a bigger wave four pullback in the coming months.
In fact, we are seeing signs of easing already:
|
All Ordinaries (XAO:ASX) Daily Line Chart
|
|
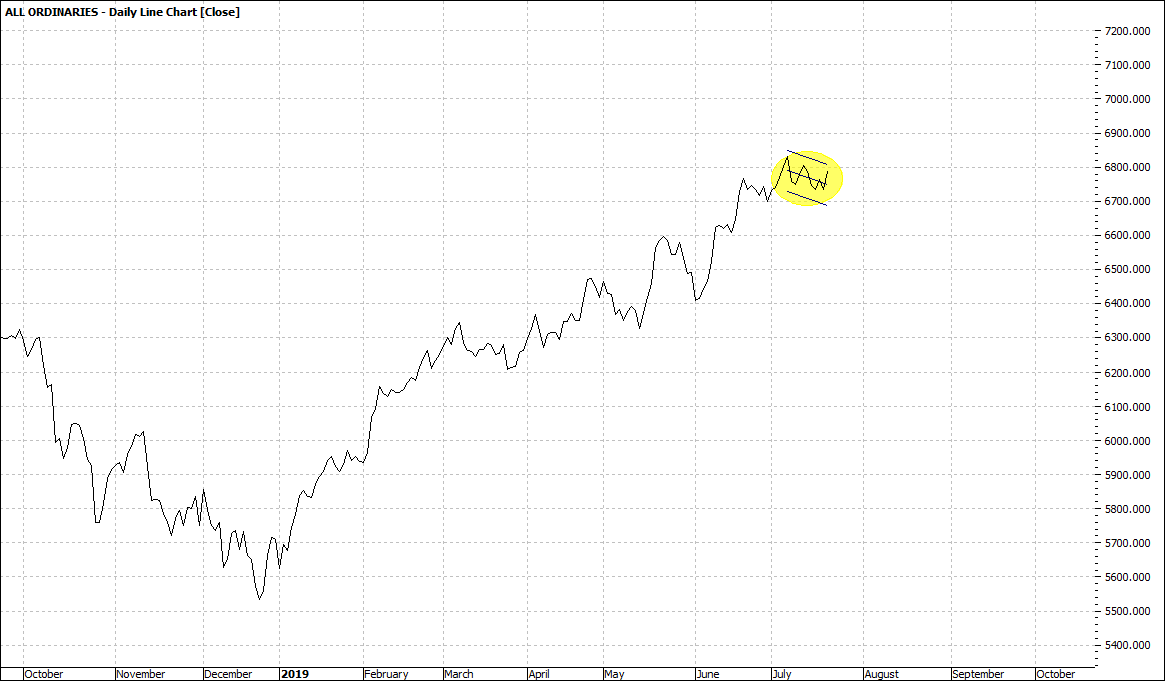
Click to Enlarge
We are seeing a downward channel potentially forming.
That is the nature of the markets. Rarely black and white answers.
Enjoy the ride
Tom Scollon
|
|
|
|
|
|
|
|