
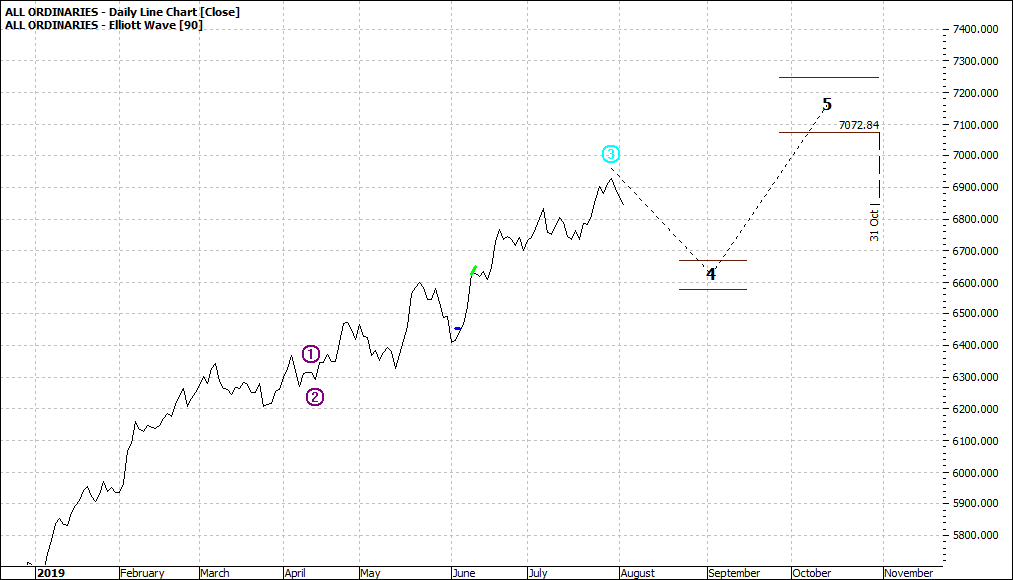
The daily and weekly XAO both show a wave four down, in the making. How can that be?
Take a look at the charts and you will be able to answer the question yourself.
|
All Ordinaries (XAO:ASX): Daily Line Chart
|
|
|
Click to Enlarge
|
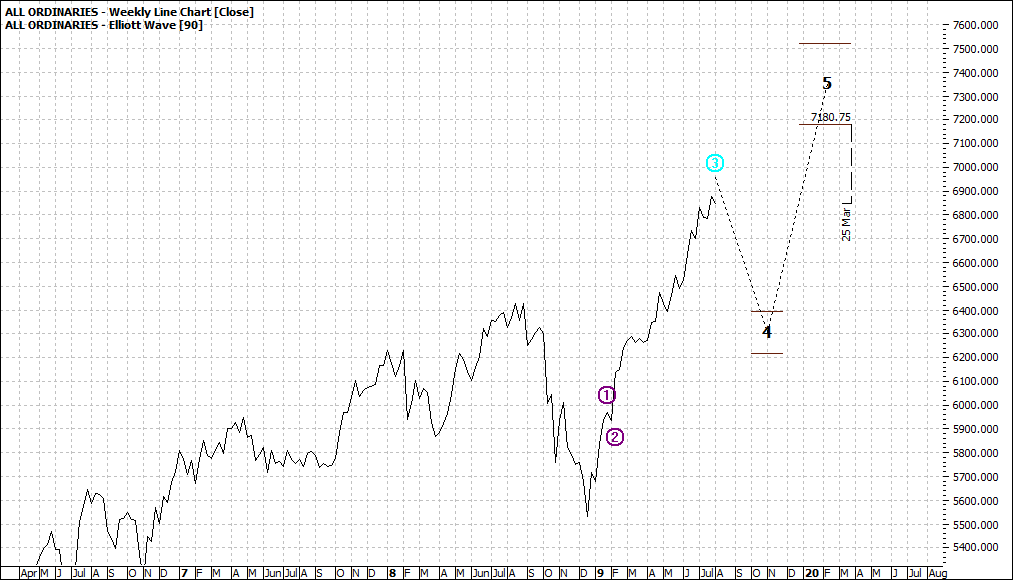
All Ordinaries (XAO:ASX): Weekly Line Chart
|
|
|
Click to Enlarge
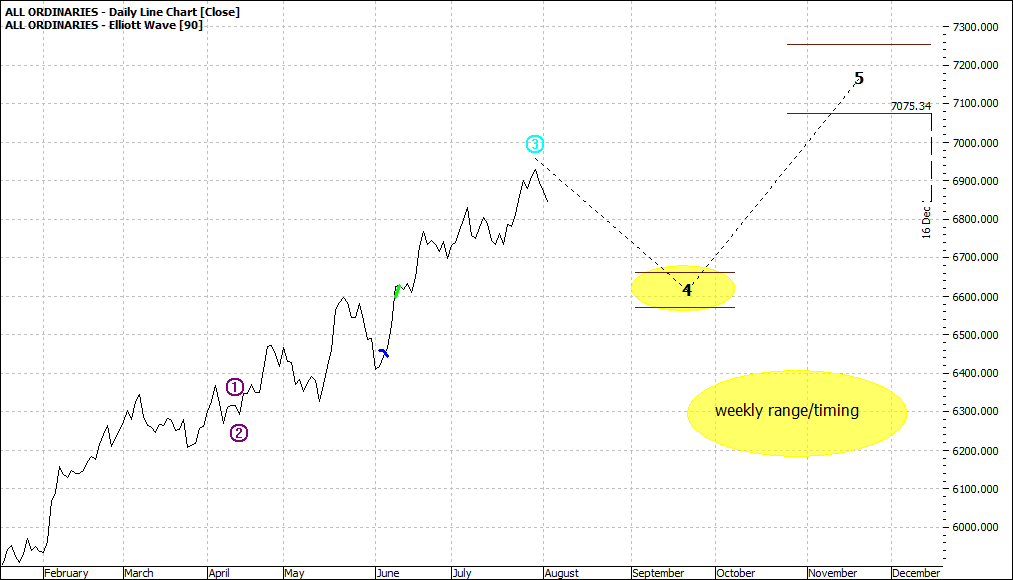
I wish to show you a third chart where I have attempted to overlay the daily and weekly pullbacks alongside each other – but focussing on the range and timing:
|
All Ordinaries (XAO:ASX): Daily Line Chart
|
|
|
Click to Enlarge
Not surprising the daily is a pullback to maybe a low of 6600 but the weekly low could be down to 6200.
Always we have to answer the question ‘’what do I do?’’
And the key here is that the answer is very much yours as is the question and will depend on numerous aspects of your circumstances.
When the market gets to the daily pullback range it thinks before the next move and if the outlook is a little bearish it will continue south.
We don’t really need to postulate a monthly picture as we have enough to deal with in the above two outlooks.
Good as Elliott is, I make no assumptions because I have seen markets go into a tale dive with such an outlook.
We should be eyes wide open.
Enjoy the ride
Tom Scollon
|