
Last week I shared the daily and weekly charts for the XAO. I ruminated on what sort of pullback we might see.
It appears the daily pullback was taken out – that is it the market went lower than the anticipated wave four level.
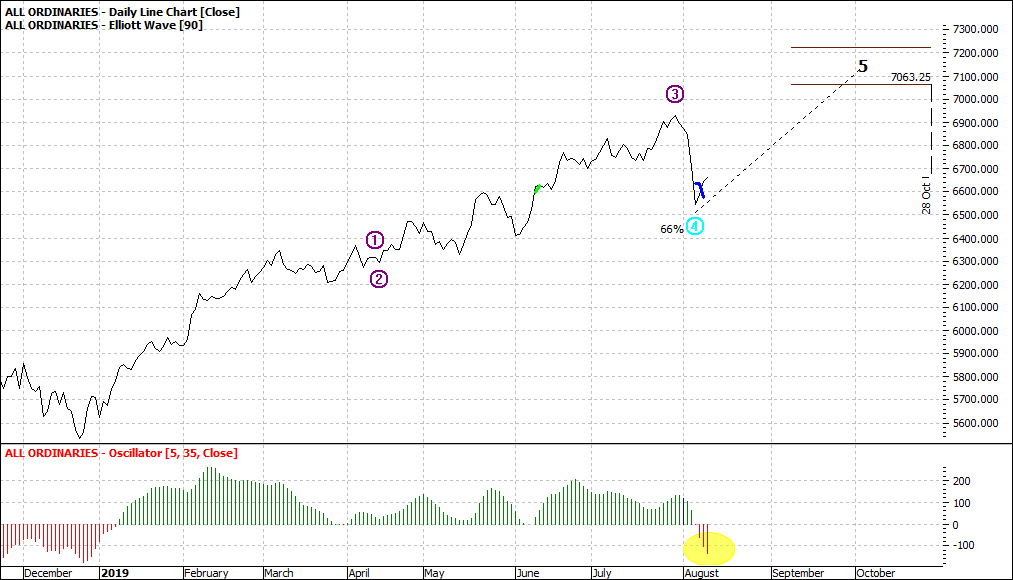
We can see this more clearly by looking at the oscillator on the daily:
|
All Ordinaries (XAO:ASX): Daily Line Chart
|
|
|
Click to Enlarge
The small but vital yellow shading indicates that there was more than an orderly profit taking – there was an element of running scared by some.
Not capitulation as that is when the majority are on their knees.
So, it appears that the outlook in the weekly chart is a more likely proposition. Not guaranteed but a higher probability. After all trading is all about probability as nothing is a certainty.
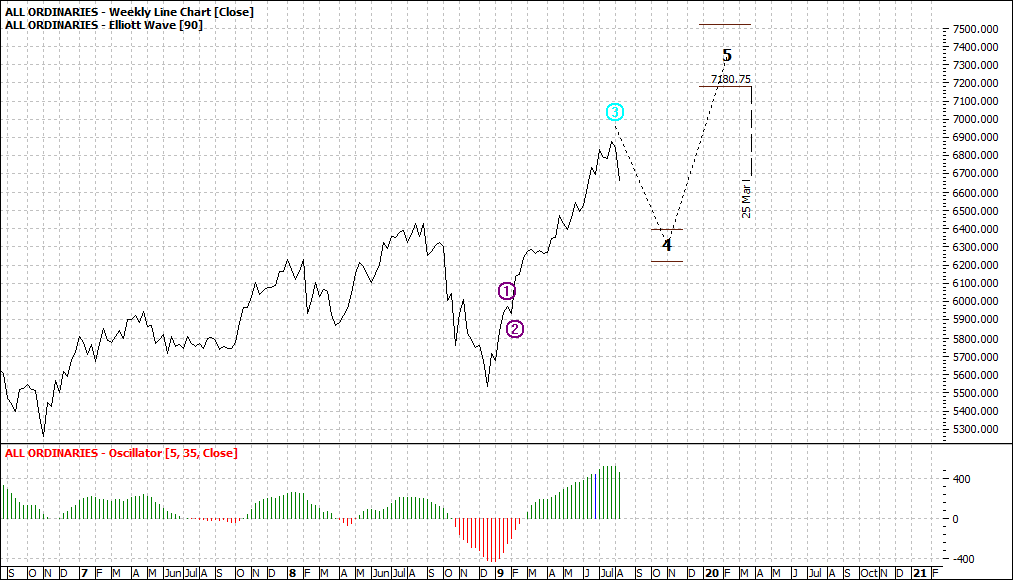
Let’s revisit the weekly chart one week along:
|
All Ordinaries (XAO:ASX): Weekly Line Chart
|
|
|
Click to Enlarge
The weekly indicates an orderly pullback. It will take some weeks possibly to be assured of this. I say possibly as at worst we could see capitulation earlier than expected and thus before an orderly pullback is allowed to play out.
In summary I favour a failed daily recovery to wave five and a first stage target of around 6400/6300 on the weekly chart. At which point we review our thoughts.
But note that could be as far out as October/November.
Enjoy the ride
Tom Scollon
|