
No; there is more fallout to happen or at best the markets will do little for a month or so.
Why do I say that?
Look at the XAO:
|
All Ordinaries (XAO:ASX): Weekly Line Chart
|
|
|

Click to Enlarge
The oscillator must come back to zero – or very close.
It will take a few weeks for a near zero oscillator as this is a weekly chart. In that time the market may not fall that much further but money in the market will make you little gain.
The other option is that the market could capitulate – or rather investors could. That is, we could see it go over a cliff. Unlikely for now.
You will recall two weeks ago we started this topic by looking at both the daily and weekly and I suggested last week that the weekly was the chart to follow as the market had crashed through the daily resistance level.
The monthly chart does not show us much that is relevant.
There are numerous economic indicators (and Monday morning fullbacks) that suggest markets should begin to nosedive but as we know markets do what they want and when they want. Timing is much debated but the least predictable aspect of investing.
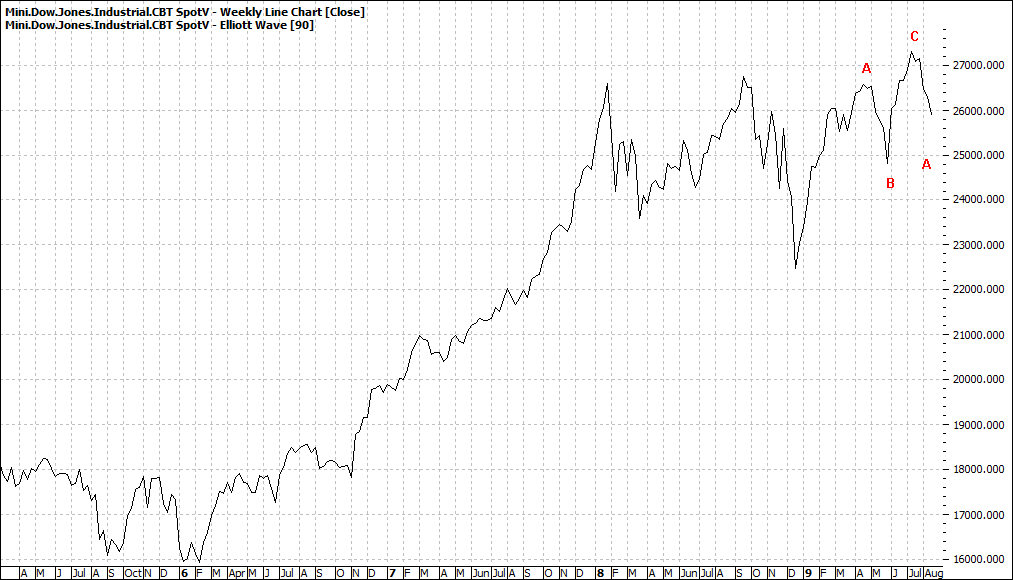
Take a look at the DOW:
|
Dow Jones Mini (EYM-Spotv:CBOT): Weekly Line Chart
|
|
|
Click to Enlarge
Both the daily and weekly say it is going nowhere – neither up nor down – just staying put at these levels.
Well of course there will be movement – sideways.
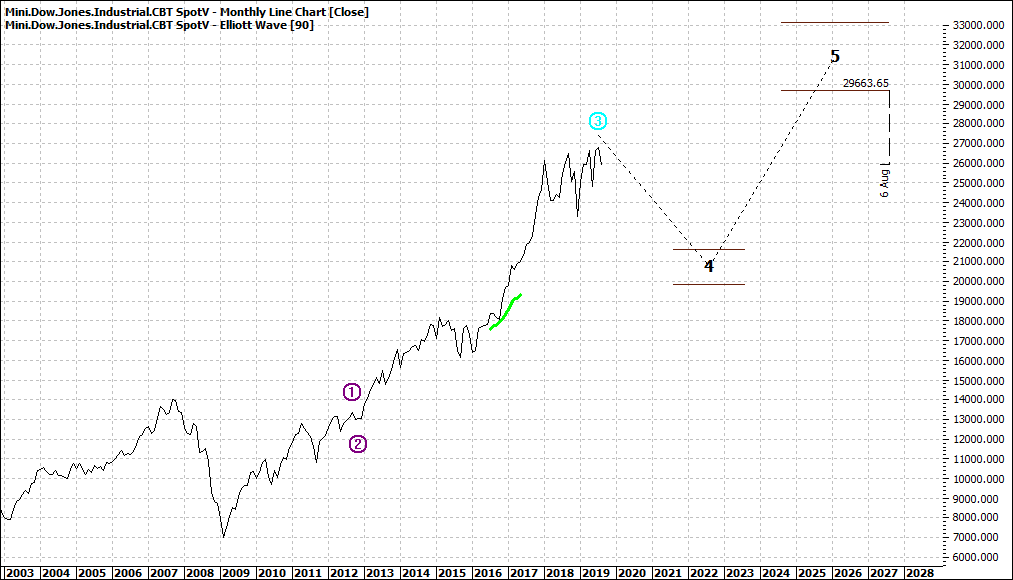
Take a look at the monthly:
|
Dow Jones Mini (EYM-Spotv:CBOT): Monthly Line Chart
|
|
|
Click to Enlarge
A decent pullback will happen but that could be some way out from here. I only show the chart to remind us that it will come.
When? We know not.
Enjoy the ride
Tom Scollon
|