
We constantly look for relatively low risk stocks. We are looking for a particular set of circumstances.
PME potentially could give us this set up and is thus a good prospect.
Let’s look at the daily and weekly charts:
|
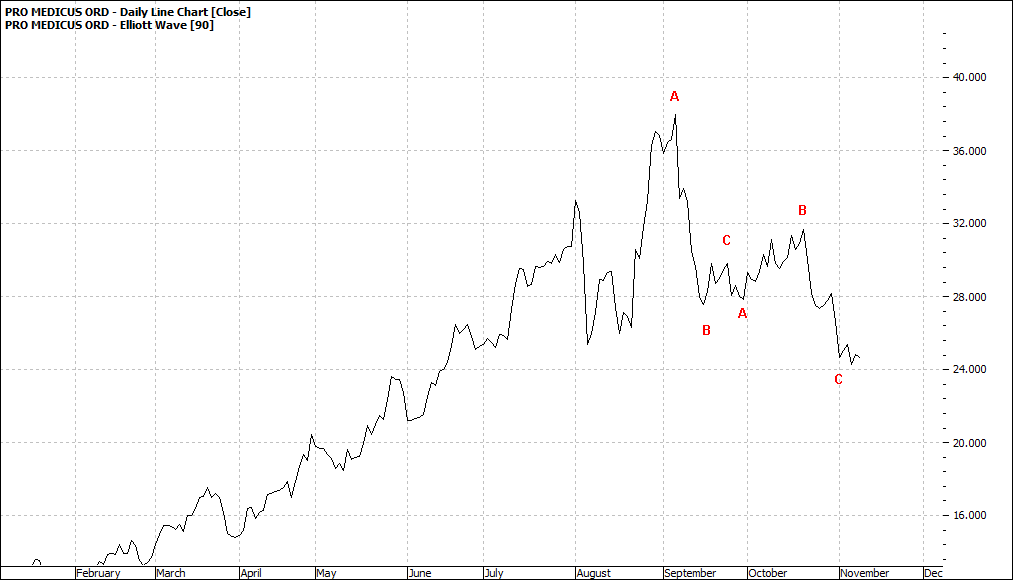
Pro Medicus (PME:ASX): Daily Line Chart
|
|
|
Click to Enlarge
|
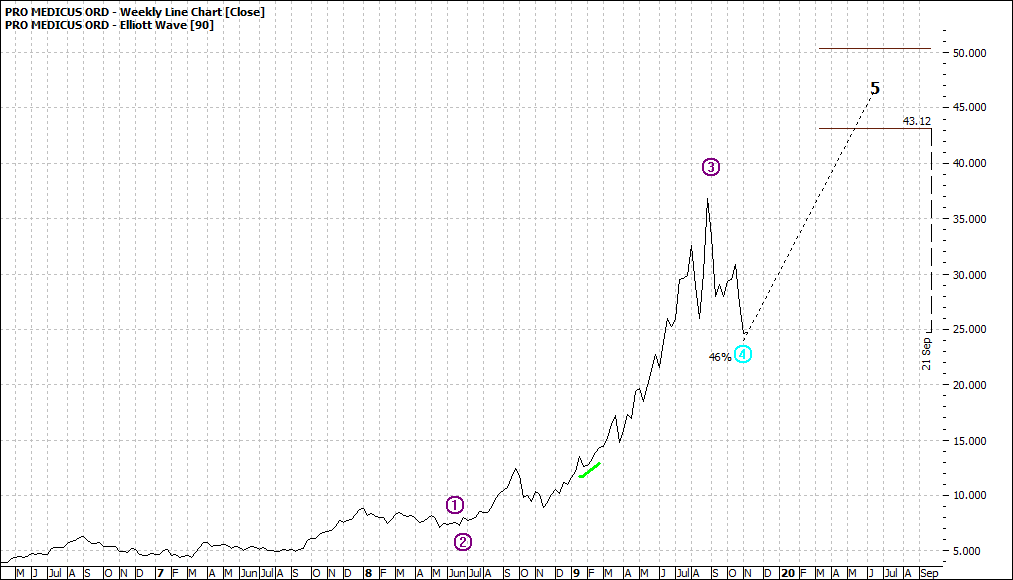
Pro Medicus (PME:ASX): Weekly Line Chart
|
|
|
Click to Enlarge
The daily does not look exciting per se but the weekly catches our eye. It shows prospects of being a rare medium-term prospect with the prospect of going from $25 to $45 in the space of a year. An 80% gain if everything lines up.
What do we want to see?
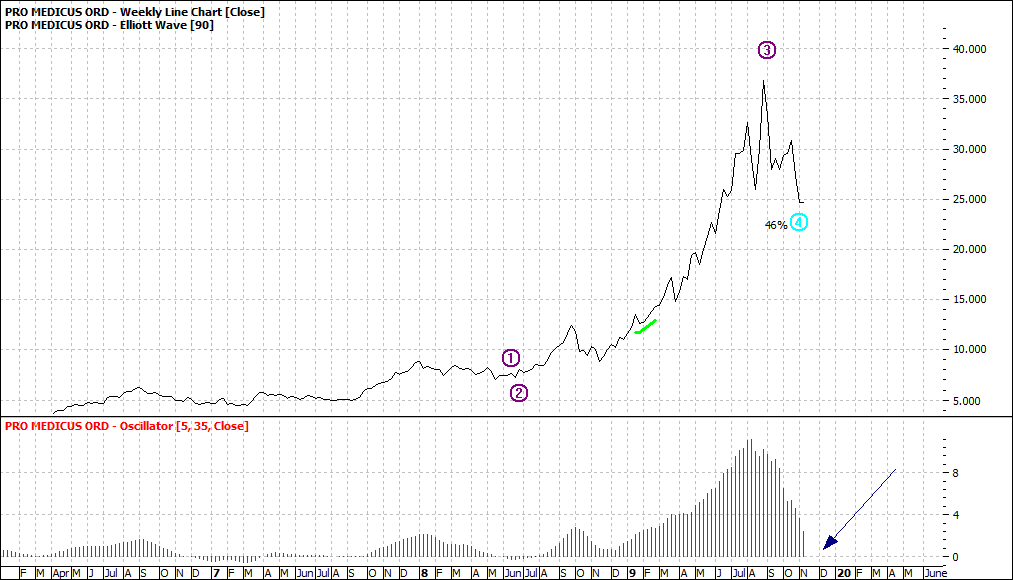
Focus on the weekly for a moment. We can see a wave four. We don’t know yet whether it is complete. If we throw on an oscillator and watch it in the coming weeks, we could see confirmation.
I say weeks as it is a weekly chart and it takes time to complete formations.
So, watch the oscillator in the chart below:
|
Pro Medicus (PME:ASX): Weekly Line Chart
|
|
|
Click to Enlarge
Now let’s look at the daily. We see a range trading pattern – an ABC pattern.
After completing a long bull run to about $37 it has consolidated, with a pullback, and all that is a healthy scenario.
We would expect it to eventually breakout and if the weekly oscillator holds, we expect a breakout to the upside.
Worth following and you have some weeks on your side.
Enjoy the ride
Tom Scollon
|