
The media are having a field day. It matters not what the issue is as long as they have one. So, we need to stand away from headlines and in this current environment distance ourselves from opinion and the hoopla.
The media is about now and rarely forward looking. They now focus on corona. But for the markets are there bigger issues ahead?
Right now, markets are overbought. Simple. There is just too much money chasing too few assets.
Of course, for many investors they need to deal with the current fall out and maybe make decisions so we will try to make some sense of the current market action.
Let’s see what we can glean from our charts.
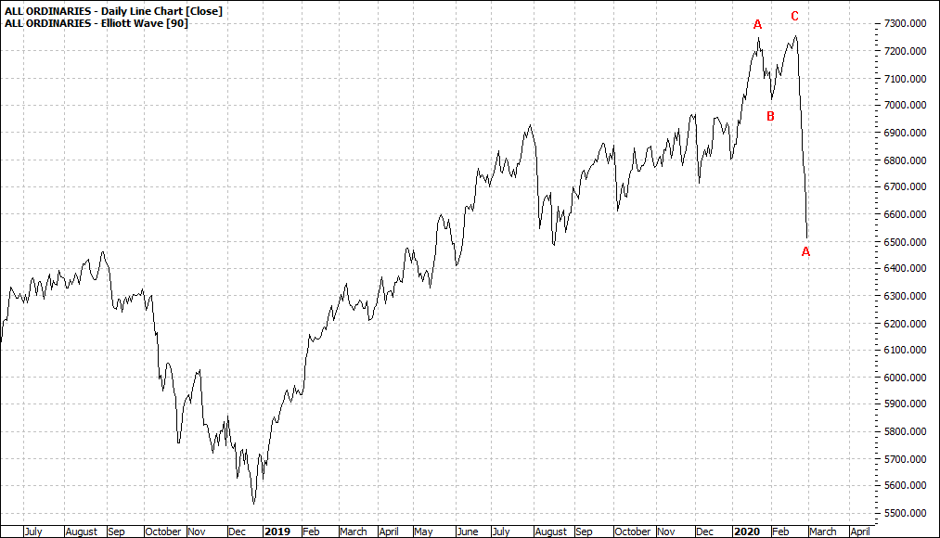
We look here at the key Australian indices – in their daily form:
|
All Ordinaries (XAO:ASX) Daily Line Chart
|
|
Click to Enlarge
|
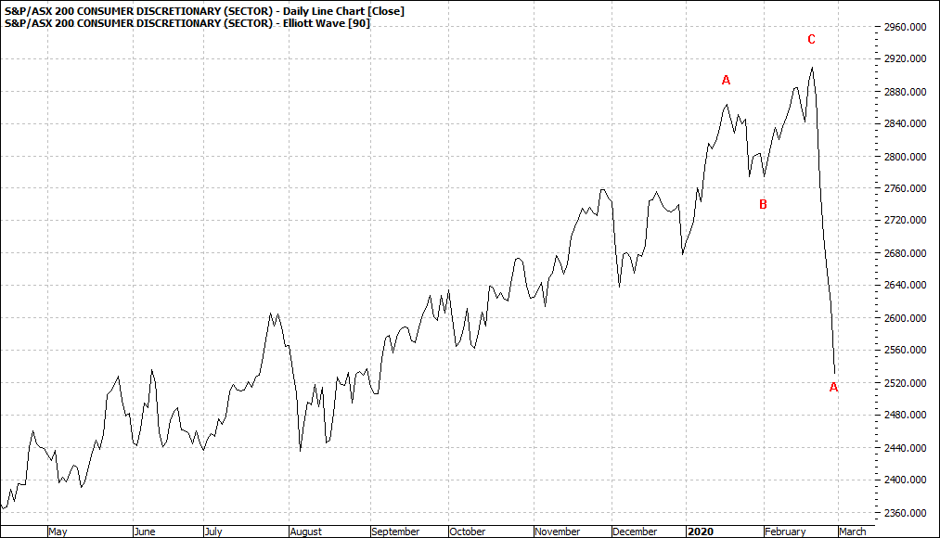
S&P ASX Consumer Discretionary (XDJ:ASX) Daily Line Chart
|
|
Click to Enlarge
|
S&P ASX Energy (XEJ) Daily Line Chart
|
|

Click to Enlarge
|
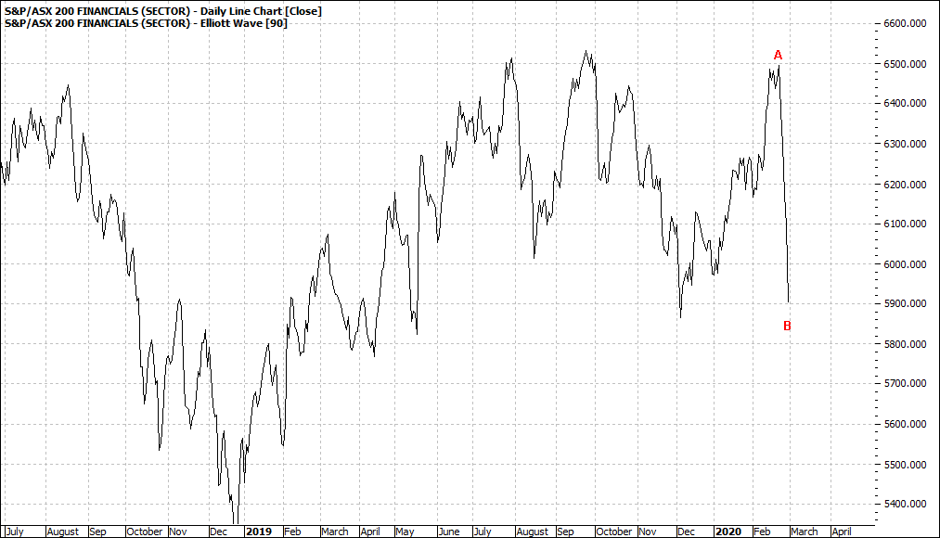
S&P ASX Financials (XFJ:ASX) Daily Line Chart
|
|
Click to Enlarge
|
S&P ASX Health (XHJ:ASX) Daily Line Chart
|
|

Click to Enlarge
|
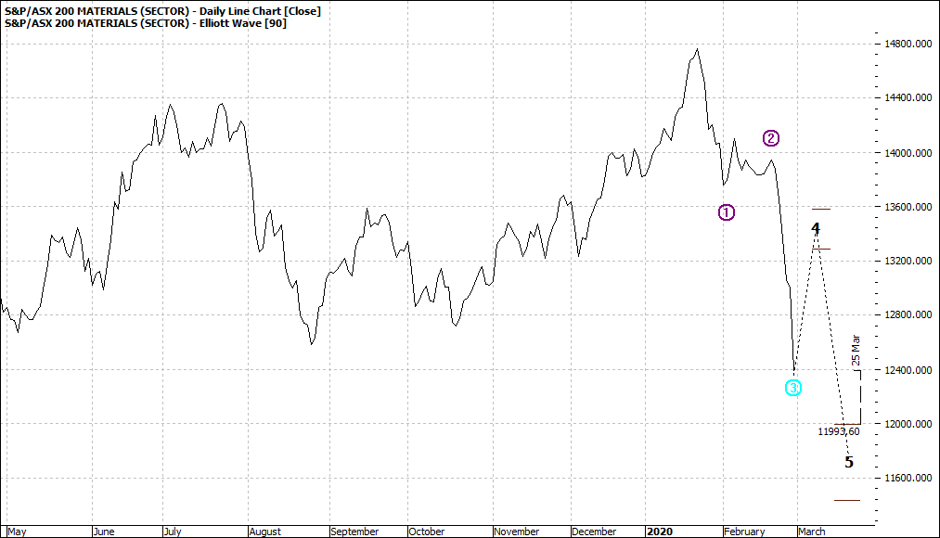
S&P ASX Materials (XMJ:ASX) Daily Line Chart
|
|
Click to Enlarge
|
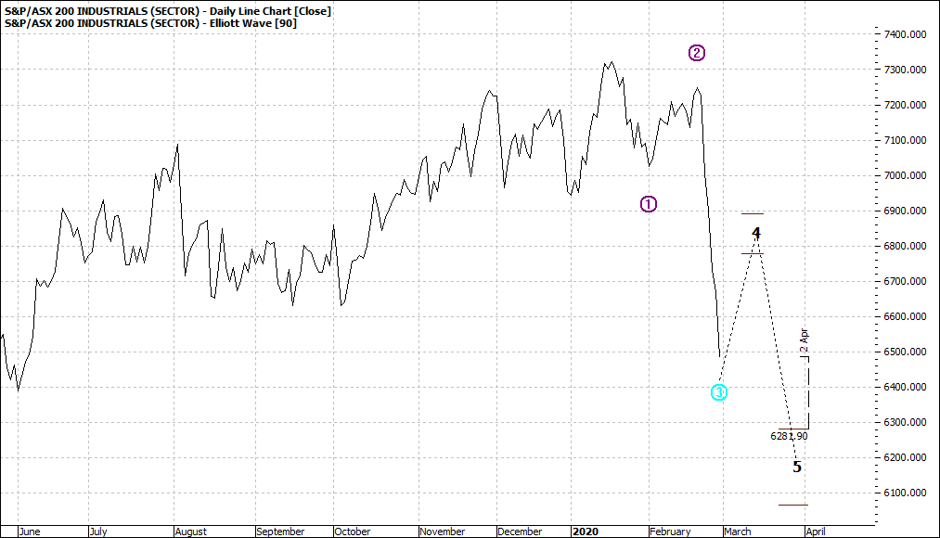
S&P ASX Industrials (XNJ:ASX) Daily Line Chart
|
|
Click to Enlarge
|
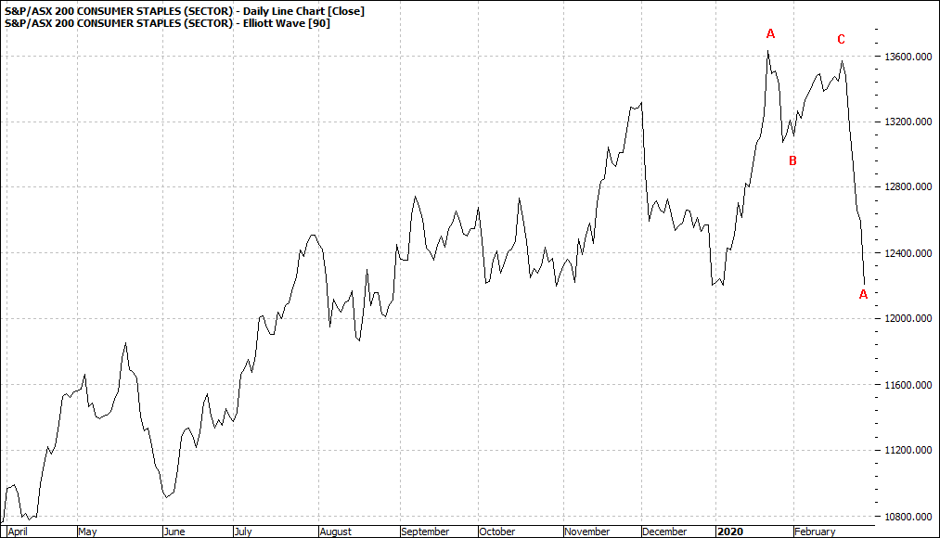
S&P ASX Consumer Staples (XSJ:ASX) Daily Line Chart
|
|
Click to Enlarge
The overall summary of the daily charts is that some sectors are almost non plussed – in particular the All Ords main index which remains in ‘’abc’’ pattern despite being hammered almost 10% for the week. Banks and the two consumer spending sectors also remain in an ‘’abc’’ pattern for now.
This is the now or relative short term.
I would be cautious however in being overly interpretive about the above daily charts. This is a time to look at weekly and monthly and beyond.
Right now everyone wants to know ‘how low can markets go?”
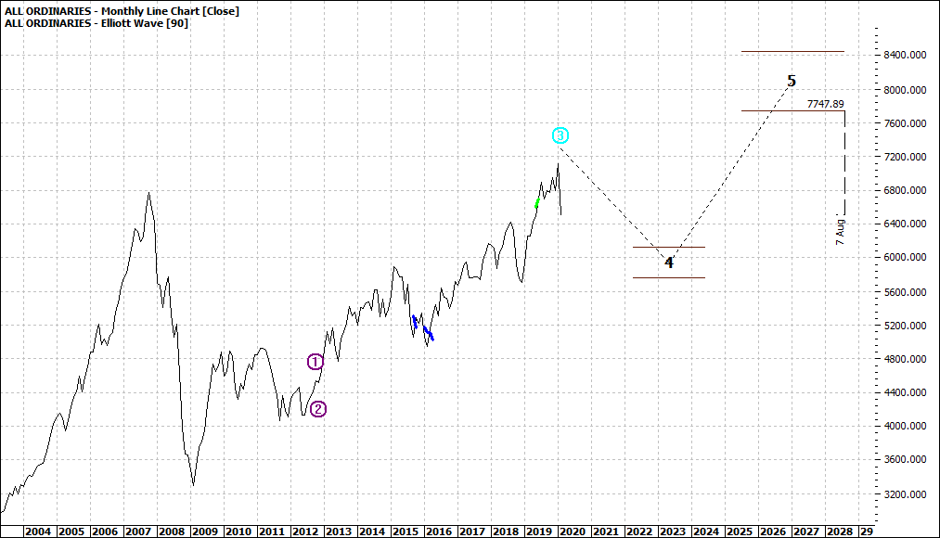
You can check this out by using the Profit Source retracement tool. I have done this for the XAO:
|
All Ordinaries (XAO:ASX) Monthly Line Chart
|
|
|
|

Click to Enlarge
Apologies for the busy chart but I want to link two ideas. We see the horizontal lines showing Fibonacci possible retracement.
In asking which level of retracement is more likely we should refresh our recollection of the 2008/9 correction after the run up from 1992/3.
It was almost 100% of the move.
The XAO monthly suggests a pullback to maybe 6000/5500:
|
All Ordinaries (XAO:ASX) Monthly Line Chart
|
|
|
|
Click to Enlarge
So, My view is that when markets go over the cliff we know not where the ledges or bottom might be. That is, we can only progressively review each day/week of data as it is a constant process of reassessing.
A further point I would make is that there has been such a massive weight of money awash in the markets for the last 20 years even the irrationality of markets is less predictable. That is, we are not seeing the consolidations to build a solid foundation for the next long move higher. Markets rapidly torpedo out of a nosedive as market punters dredge the so-called market bottom for bargains.
Beware.
And one final point. This may not be the real correction. There could be the mother of all corrections still to come. I am not bearish. On the contrary. For buy and hold investors the real easy pickings may be some time off yet.
My key point is that if ever there was an absolutely critical time to take a slow view of the markets that time is now.
Enjoy the ride
Tom Scollon
|
|
|
|
|
|
|