
Well relatively speaking. The market was pushed over a cliff a couple of months ago. It seemed the end of the world was nigh. And then spiked back up again in a flash. The question on most people’s mind is what is real - these days in more ways than one.
Firstly, without ado let’s look at the charts. The XAO in various forms:
|
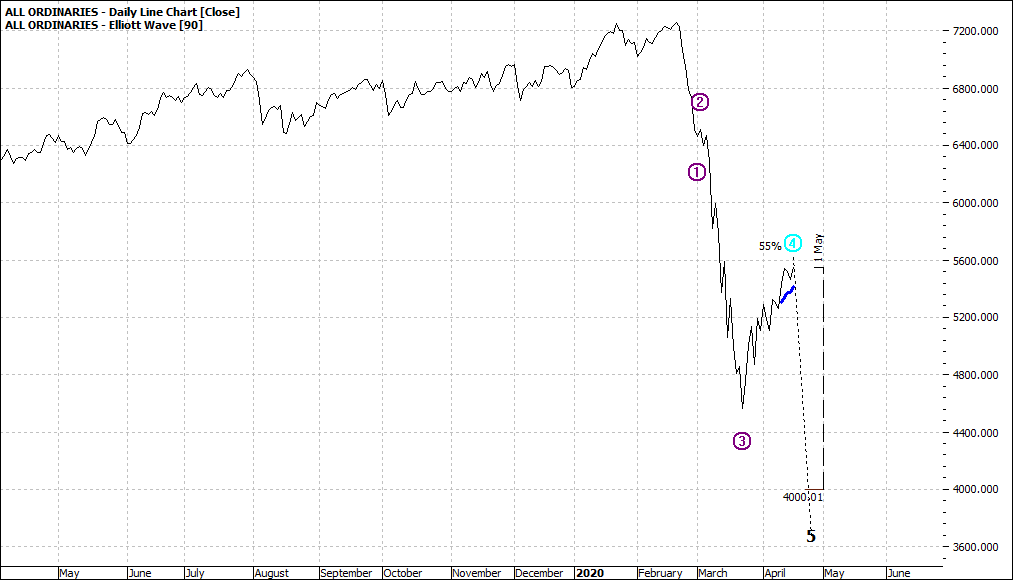
All Ordinaries (XAO:ASX) Daily Line Chart
|
|
Click to Enlarge
|
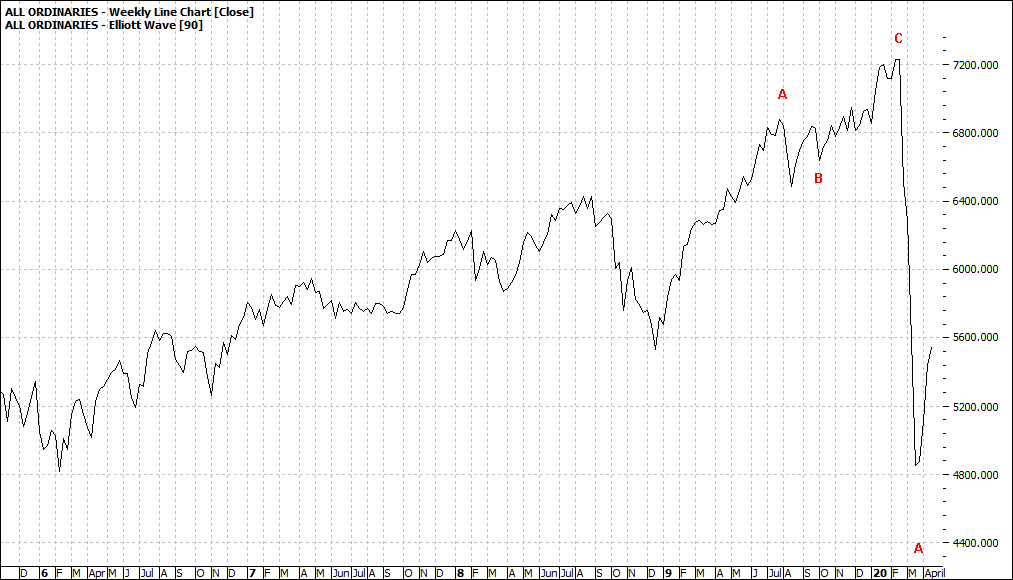
All Ordinaries (XAO:ASX) Weekly Line Chart
|
|
Click to Enlarge
|
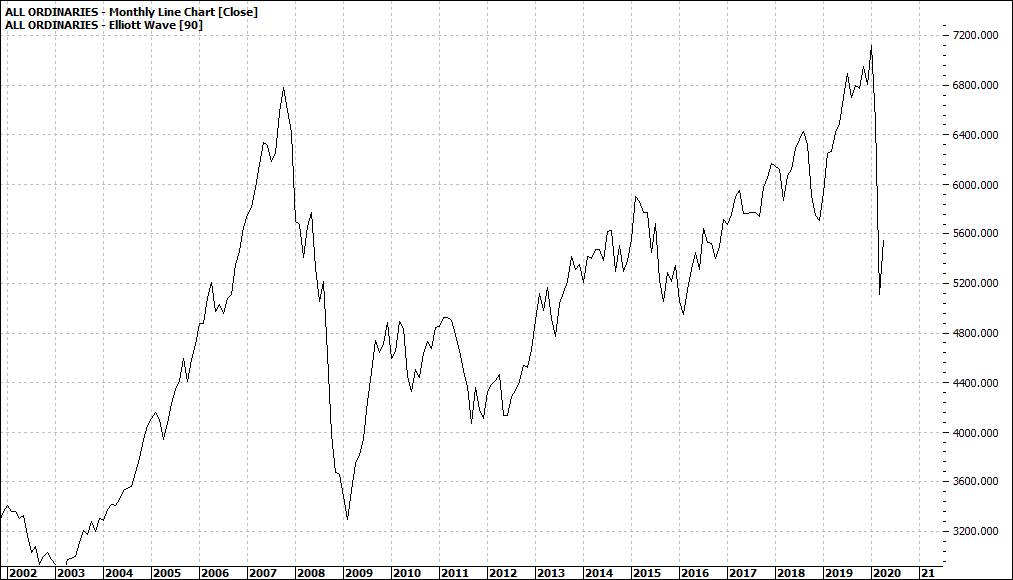
All Ordinaries (XAO:ASX) Monthly Line Chart
|
|
Click to Enlarge
|
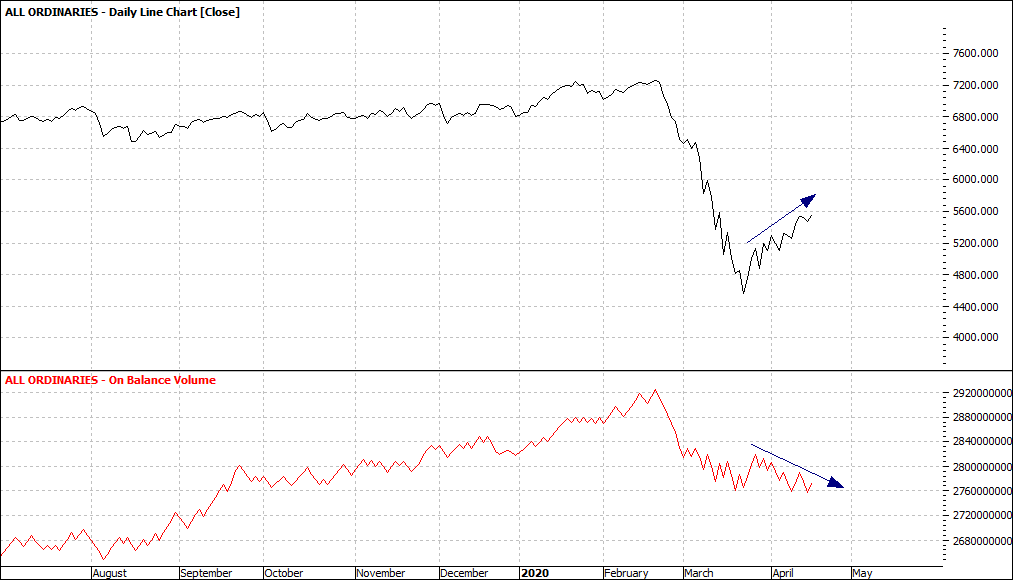
All Ordinaries: On Balance Volume (XAO:ASX) Daily Line Chart
|
|
Click to Enlarge
|
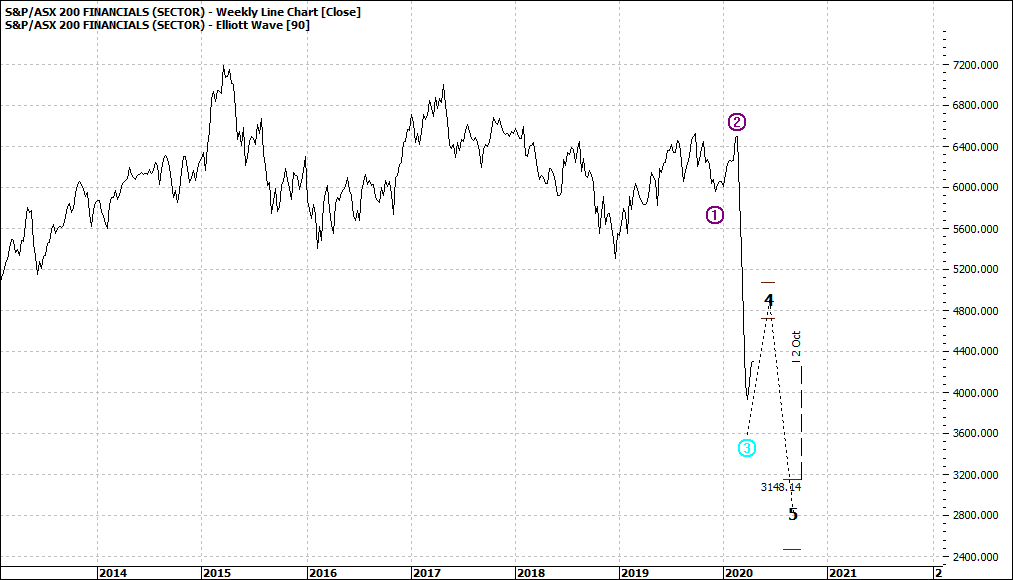
S&P ASX Financials (XFJ:ASX) Weekly Line Chart
|
|
Click to Enlarge
I explore many charts before I start to write my articles and choose those that I think have most relevance.
The weekly and monthly XAO charts do not provide us with much in the way of clues. The daily is worthy of note. It suggests another leg down to the 4000 level.
Now there are many that would have it that this recent spike up is for real. If you look at the OBV chart you will note that price has risen but not volume. This is not a widely supported rally.
I could proffer many fundamental reasons why this rally cannot be sustained but the charts suffice.
And lastly, we look at the XFJ. The reason I include this is that it is the major sector accounting for about 40% of the All Ords.
Forty percent of the market looks shaky.
Enjoy the ride
Tom Scollon
|
|
|
|
|
|