
If one had not looked at the charts or listened to media over the past few weeks, you could be forgiven for thinking we were in a bull market. It has had that feeling about it. Led by the bullish US markets – for why we do not know.
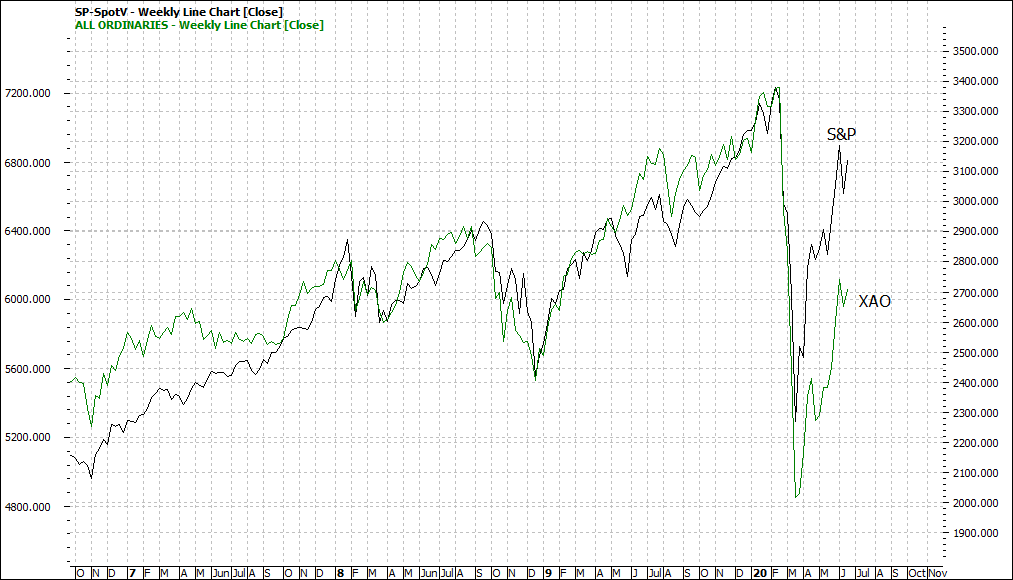
Let’s compare the XAO and the S&P:
|
S&P 500 v ASX All ords - Weekly Overlay Chart
|
|
|
Click to Enlarge
The S&P has romped ahead and whilst the Australian market has followed suit, this has been to a more cautious level.
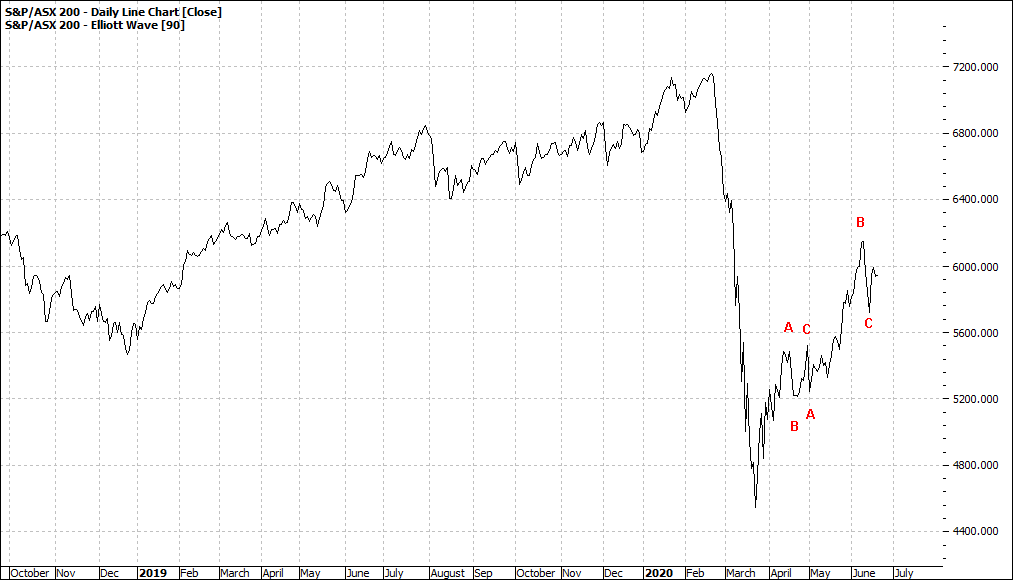
Let's look at the Australian market via a daily chart, a weekly and a monthly:
|
S&P ASX 200 (XJO:ASX) - Daily Line Chart
|
|
|
Click to Enlarge
|
S&P ASX 200 (XJO:ASX) - Weekly Line Chart
|
|
|

Click to Enlarge
|
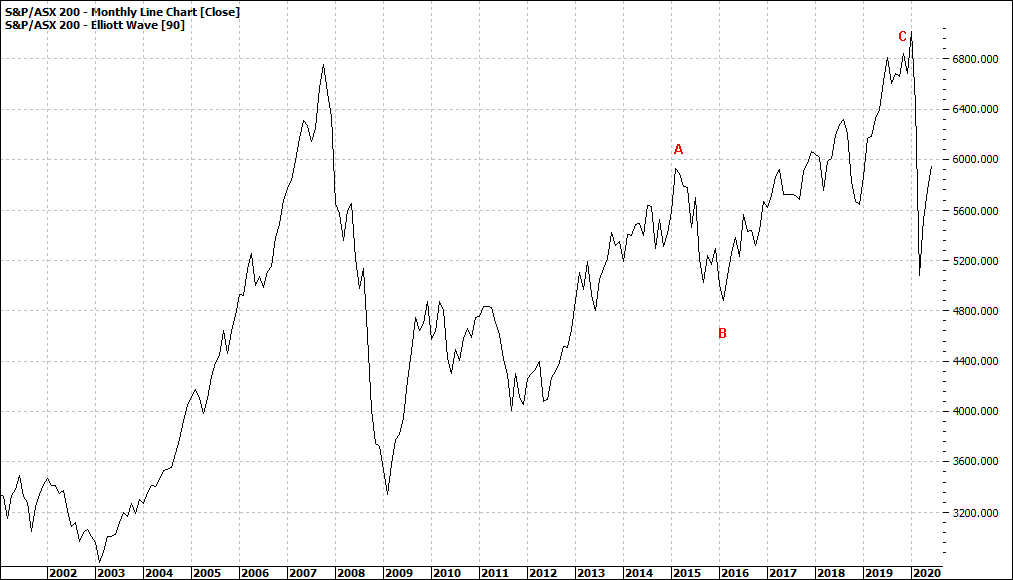
S&P ASX 200 (XJO:ASX) - Monthly Line Chart
|
|
|
Click to Enlarge
You will note all are in a corrective range trading mode. Of course, they can go both higher and lower whilst range trading. Think of it as a market without a strong trend. We could see action in the coming days and weeks that will change this to a trend – down or up.
Range trading markets can be very handy in that they are drawing breath and investors can do likewise – pause from the frenetic pace.
So, a time to take stock and watch for the next direction or move.
Enjoy the ride
Tom Scollon
|