|
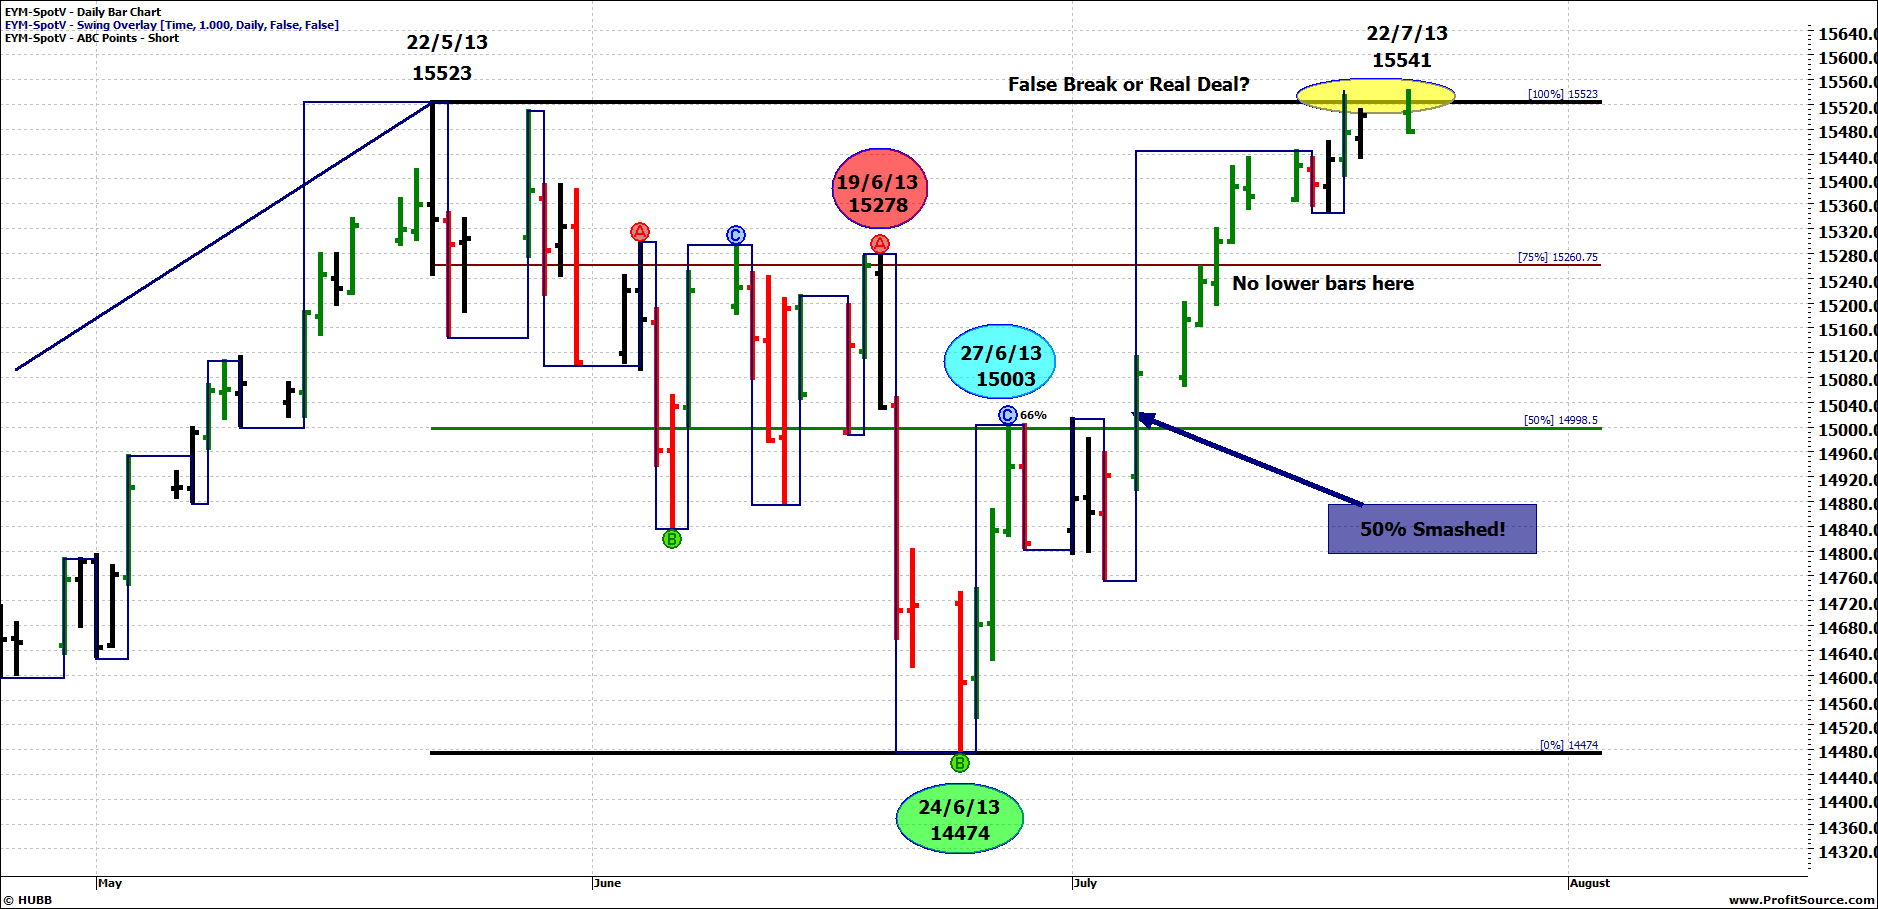
Early July in the U.S. signalled the start of the latest ‘Earnings Season’ and another stellar charge by this seemingly tireless bull. Readers of the Platinum Newsletters would be familiar with my Mini-Dow Futures (Code EYM-SpotV in ProfitSource) analysis of the speed angles (the pitch of the moves) seen throughout this bull market that started way back in March 2009. To briefly recap, the previous move from the 16 November 2012 low (12434) to the recent 22 May 2013 high (15523) ran up at a record pitch of 16.5 points per day. This latest rally which started on 24 June (14474) to the current session high on 22 July (15541) sets a new record of 1067 points in 28 days, which is just over 38 points per day!
Personally I made some short trades late in May coming off the 22 May high (15523) that yielded nicely profitable results. The fall into the 24 June low was terrific with the market falling over 800 points in 4 trading sessions. That 800 point fall set-up us up for what looked to all intents and purposes as a nice potential ABC short trade.
Point A – 19 June @ 15278
Point B – 24 June @ 14474
Point C – 27 June @ 15003
A 50% retracement level also added to the potential for this trade. Taking the Gann Retracement tool and running it across the range from 22 May (15523) to 24 June (14474), the 50% resistance level comes in at 14998.5. That’s close enough to Point C for me. Chart 1 is the daily bar chart for the Mini-Dow highlighting this ABC pattern.
Chart 1 – Mini-Dow Daily Bar Chart Failed ABC Short the 50% Retracement Level
Click to Enlarge
Now I’m not sure if you are reading this and asking yourself, “What have I missed, that trade failed?” That’s exactly the reason I’m showing you this trade. If you took this trade and were ambushed, I really feel you can reflect back and think to yourself, “I did nothing wrong”. There are many times that a set-up like this will yield good results.
Getting back to the story presently unfolding on the chart, when on 5 July (after the Independence Day Holiday) the market exploded to the upside and clearly through the 50% retracement level of 14998.5, the next level to watch was the 75% retracement level, 15260.75. As you can see on the chart this time around the market did not even stop for a breather here and continued on to retest the 22 May high of 15523, which is where we are at now.
David Bowden teaches us about ‘Blow-off’ tops or ‘Rope a Dope’ tops. This run up at 38 points per day has been simply stellar, but can it last or is it a great deal of short covering (all those still short since 22 May)? Time will tell. I’m watching the market live tonight, and early in the session (22 July) the market has pushed weakly to new a new high (15541) and is currently trading at 15479. For the bulls to prove genuine strength in this move, the market will need to close above the 22 May high (15523) for at least 3 consecutive days. At this stage it has not closed above that level on even one occasion.
Should the market fail to pass this ‘3 consecutive closes’ test then we may well have a ‘False Break’ on the cards and top. Conversely, should prices break above and hold on the ‘closes’, then prices may very well be destined for higher yet. I certainly haven’t been bold enough to buy this rally, but I’m pleased to say I also have been holding on short watching profits quickly evaporate. There is certainly an interesting few days ahead.
Until next month…
Noel Campbell Professional Derivatives Trader |